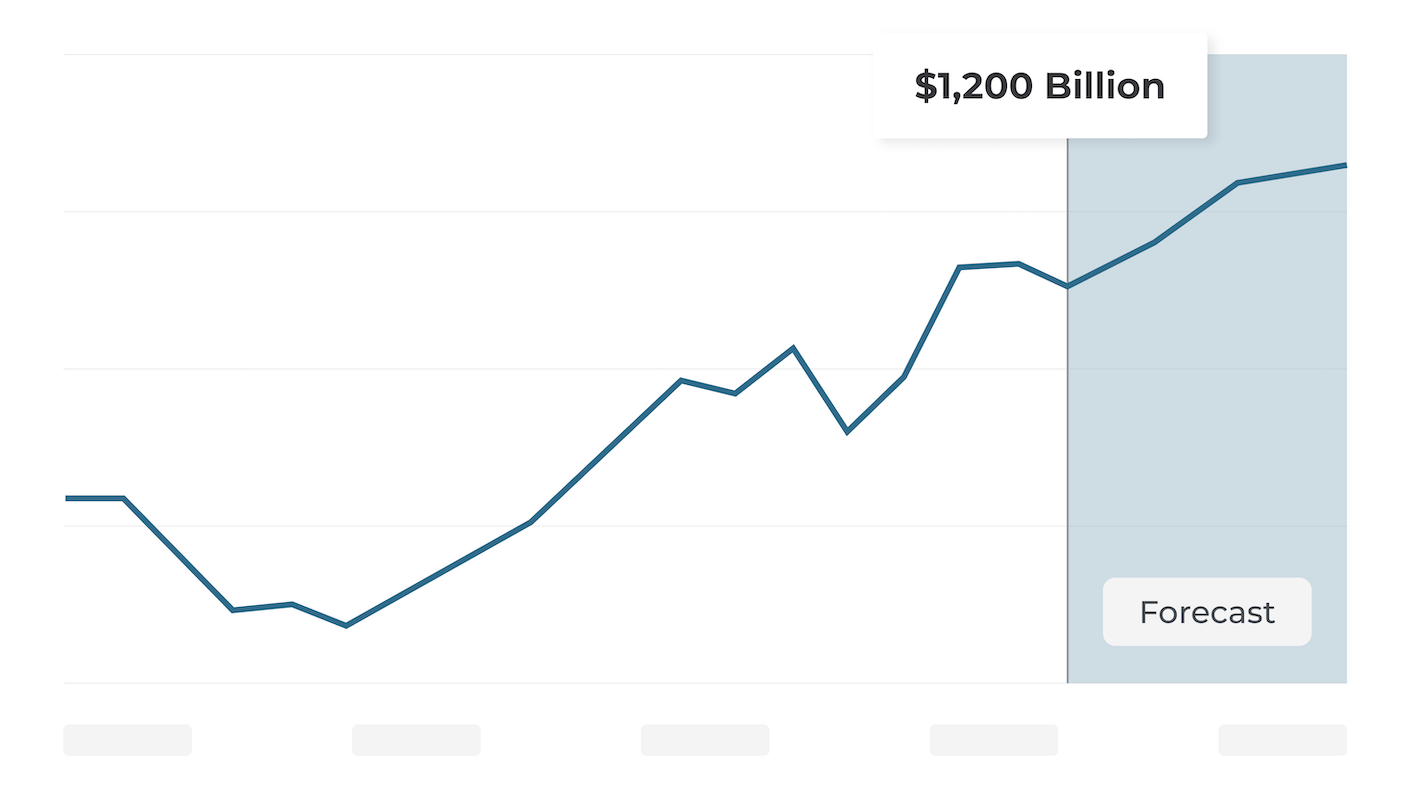
By: Alex Carrick on January 13th, 2021
Nonresidential Construction Starts Falter in December; Full Year 2020 -27% vs 2019
Mega Project Collapse in 2020
ConstructConnect announced today that the latest month’s volume of construction starts, excluding residential work, was $20.8 billion, a decline of -30.9% versus November's $30.2 billion (originally reported as $28.9 billion).

In a year of starts that was severely diminished by the coronavirus pandemic, perhaps the most striking feature was the collapse in ‘mega’ projects (i.e., groundbreakings of a million dollars or more each). In 2019, there were 35 mega project initiations summing to $79.1 billion. Last year, there were only a dozen such projects, combining for a value of $21.0 billion. The drop in mega project dollar volume was -73.5%, or nearly three-quarters.
View this information as an infographic.
Click here to download the complete Construction Industry Snapshot Package - December 2020 PDF.
Emphasizing how bad the final month of 2020 was for total nonresidential starts, their decline relative to December 2019 was -46.0%. In other words, they were down by nearly half.
As for 2020’s full year starts, they were off by a little more than one-quarter, -27.3%. December year-to-date numbers are the full year or annual figures. ‘Institutional’ was the type-of-structure category than managed the smallest annual retreat, -14.6%.
Rays of Optimism in the Outlook
There are several good reasons to feel somewhat more optimistic about the economic outlook. They can be summarized as follows:
- However hesitantly, effective coronavirus vaccines are being rolled out;
- Personal savings have soared to a record high which will facilitate spending on…
- Pent-up demand that has accumulated for single-family housing, recreation, travel, elective medical procedures, etc.;
- The price of oil has climbed back to a reasonable level, above $50 USD per barrel;
- China is ramping up infrastructure spending, which will help lift all commodity prices.
Construction Jobs +51,000 in December
Before there is blanket protection from the coronavirus, however, there is likely to be a weak first quarter to 2021. With a resurgence in COVID-19 case counts at the end of last year, which forced many restaurant and other enterprise reopening efforts to be shelved or rolled back, total employment in the U.S. shrank by -140,000 jobs in December. (The net effect, though, was essentially zero, since November’s total jobs figure has most recently been revised upwards by +135,000 jobs from what was originally reported.)
U.S. total jobs recovery since the floor fell out of employment from February-to-April 2020 is a still lackluster 52.1%. The year-over-year performance of jobs in the hardest-hit sector of the economy, leisure and hospitality, is -22.8% (i.e., a shredding of nearly a quarter of all positions). The construction sector’s year-over-year jobs record has been a relatively innocuous -1.9%.
Construction achieved a +51,000 increase in staffing in the latest month (according to the survey of employers). Nevertheless, the sector’s not seasonally adjusted (NSA) unemployment rate (derived from a different survey, the ‘household’ survey) rose to 9.6%, an uptick from November’s 7.3% and well above December 2019’s 5.0%.
Table 1: Monitoring the U.S. employment recovery ‒ December 2020

Chart: ConstructConnect.
Graph 1: Y/Y Jobs Change, U.S. Total Industry & Major Subsectors − December 2020 (based on seasonally adjusted payroll data)

Chart: ConstructConnect.

Chart: ConstructConnect.
Institutional and Engineering Suffered Least Harm
The -30.9% drop for total nonresidential starts in December versus November (m/m) was the result of big slides in industrial, -77.8%; commercial, -53.2%; and institutional, -34.9%, volumes; while heavy engineering/civil stepped back to a lesser degree, -7.8%.
The -46.0% plummet in December 2020 compared with December 2019 (y/y), for total nonresidential starts, was caused by sizable pullbacks in all type-of-structure categories: industrial, -92.1%; commercial, -58.1%; engineering, -39.4%; and institutional, -38.8%.
2020’s full year fall-off in nonresidential starts of -27.3% relative to 2019 (ytd) was centered more in the industrial and commercial type-of-structure categories (-68.0% and -34.2% respectively) than in engineering and institutional work (-19.1% and -14.6%).
The bottom line is that, in 2020, institutional and engineering starts were caught in harm’s way, but not to the same stomach-churning degree as industrial and commercial.
Some Dramatic Shifts in Shares Taken by Subsectors
In 2020, some interesting shifts in the composition of commercial, institutional, and engineering starts occurred. ‘Hotel/motel’ starts as a share of commercial eased back to 11% from 15% in 2019. In 2018 and 2017, they had been at 20%.
Warehouse starts as a share of commercial soared to 24% in 2020 from just 15% the year before. At +1.3% annual growth, warehouse starts were one of only three subcategories to register an increase in dollar volume, full year 2020 over full year 2019.
The other two subcategories with full-year gains were within institutional starts ‒ ‘fire/police/courthouse/prison,’ +18.5%, and ‘military,’ +81.3%. Combined, those two subcategories as a share of institutional increased to 15% in 2020 from 9% in the prior year.
Health care starts, though, as the combination of ‘hospital,’ ‘nursing homes,’ and ‘miscellaneous medical,’ slipped to 23% of institutional from around 30% in past years.
‘School/college’ starts within institutional claimed their usual share of just under 60%.
Within engineering, ‘road/highway’ starts soared to 41% from 34% in 2019. Most dramatic, though, was the plunge in share claimed by ‘miscellaneous civil,’ sinking to 14% last year from 25% in 2019. The wealth of mega project work that was green-lighted in 2019 was heavily skewed towards the ‘miscellaneous civil’ category (e.g., rapid transit lines and LNG and other petrochemical energy projects).
Table 2 dives into 2020 subsector starts with even greater granularity. For example, within ‘fire/police/courthouse/prison’ starts, it was courthouses that registered the largest percentage jump, +51.9%. Within educational facility starts, the declines for ‘K-12’ and ‘colleges/universities’ were on a par, -13.8% and -13.5%.
Table 2: Construction Starts in Some Additional Type of Structure Sub-Categories
Jan-dec 2020 | % Change vs | |
($ billions) | Jan-dec 2019 | |
Sports Stadiums/Convention Centers | $4.330 | -56.0% |
Transportation Teminals | $2.354 | -78.1% |
Courthouses | $2.381 | 51.9% |
Police Stations & Fire Halls | $3.362 | 3.1% |
Prisons | $2.480 | 17.5% |
Pre-School/Elementary | $19.518 | -9.0% |
Junior & Senior High Schools | $27.262 | -17.0% |
K-12 (sum of above two categories) | $46.780 | -13.8% |
Special & Vocational Schools | $3.848 | 0.9% |
Colleges & Universities | $34.029 | -13.5% |
Electric Power Infrastructure | $3.565 | -75.7% |
Data Source and Table: ConstructConnect.
Table 3: Ranking of Top 20 States by YTD $ Volume of Nonresidential Construction Starts - ConstructConnect
Jan-DEC 2020 | % Change vs Jan-DEC 2019 | ||
1 | Texas | $48,606,249,018 | -44.3% |
2 | California | $38,393,082,049 | -7.4% |
3 | Florida | $23,605,330,326 | -29.1% |
4 | New York | $19,234,666,679 | -33.4% |
5 | Illinois | $15,246,810,879 | -11.2% |
6 | Ohio | $13,548,895,243 | -10.7% |
7 | Washington | $12,546,870,175 | -33.3% |
8 | Georgia | $10,907,774,599 | -42.2% |
9 | Pennsylvania | $10,875,819,981 | -30.2% |
10 | Virginia | $10,604,371,923 | -28.9% |
11 | North Carolina | $10,006,070,459 | -43.6% |
12 | Missouri | $9,099,611,172 | 12.6% |
13 | Massachusetts | $9,037,511,141 | -33.4% |
14 | Minnesota | $8,559,920,212 | -21.8% |
15 | Wisconsin | $8,448,065,622 | -23.0% |
16 | Indiana | $7,951,894,615 | -10.4% |
17 | Tennessee | $7,916,084,769 | -9.4% |
18 | Arizona | $7,601,065,321 | -22.9% |
19 | New Jersey | $7,578,541,854 | -16.8% |
20 | Michigan | $7,373,720,967 | -43.7% |
Figures are comprised of non-res building & engineering (residential is omitted).
Data Source and Table: ConstructConnect.
Table 4: Ranking of Top 20 States by YTD $ Volume of Nonresidential Building Construction Starts - ConstructConnect
Jan-DEC 2020 | % Change vs Jan-DEC 2019 | ||
1 | Texas | $29,430,145,860 | -53.5% |
2 | California | $20,220,823,524 | -21.9% |
3 | Florida | $14,905,046,477 | -21.3% |
4 | New York | $14,059,621,297 | -33.3% |
5 | Ohio | $8,817,949,394 | -11.7% |
6 | Illinois | $8,265,438,612 | -6.5% |
7 | North Carolina | $7,588,396,149 | -30.1% |
8 | Virginia | $6,855,339,204 | -11.0% |
9 | Georgia | $6,853,634,360 | -54.6% |
10 | Missouri | $6,798,432,542 | 19.0% |
11 | Pennsylvania | $6,278,981,580 | -33.0% |
12 | Massachusetts | $6,044,252,457 | -36.3% |
13 | Tennessee | $5,844,020,004 | -6.0% |
14 | Arizona | $5,633,358,785 | -9.9% |
15 | Washington | $5,599,118,560 | -56.7% |
16 | Wisconsin | $5,244,838,873 | -26.4% |
17 | Maryland | $5,212,946,805 | 3.1% |
18 | Indiana | $4,600,129,830 | -25.4% |
19 | Colorado | $4,378,252,174 | -43.9% |
20 | Utah | $4,166,397,862 | 9.0% |
Data Source and Table: ConstructConnect.
Table 5: Ranking of Top 20 States by YTD $ Volume of Heavy/Engineering Civil Construction Starts - ConstructConnect
Jan-DEC 2020 | % Change vs Jan-DEC 2019 | ||
1 | Texas | $19,176,103,158 | -20.1% |
2 | California | $18,172,258,525 | 16.7% |
3 | Florida | $8,700,283,849 | -39.4% |
4 | Illinois | $6,981,372,267 | -16.1% |
5 | Washington | $6,947,751,615 | 17.9% |
6 | New York | $5,175,045,382 | -33.7% |
7 | Ohio | $4,730,945,849 | -8.7% |
8 | Pennsylvania | $4,596,838,401 | -26.0% |
9 | Minnesota | $4,473,060,887 | -28.3% |
10 | Georgia | $4,054,140,239 | 7.0% |
11 | Virginia | $3,749,032,719 | -48.0% |
12 | New Jersey | $3,546,585,901 | 0.2% |
13 | Indiana | $3,351,764,785 | 23.6% |
14 | Michigan | $3,263,895,708 | -50.9% |
15 | Wisconsin | $3,203,226,749 | -16.5% |
16 | Massachusetts | $2,993,258,684 | -26.7% |
17 | Louisiana | $2,902,613,902 | 31.8% |
18 | Iowa | $2,543,997,541 | -19.2% |
19 | North Carolina | $2,417,674,310 | -64.9% |
20 | Colorado | $2,327,044,525 | -34.1% |
Data Source and Table: ConstructConnect.
Not Seasonally Adjusted (NSA) Current $s, Moving 4-Quarter Totals

Chart: ConstructConnect.
10 of 12 Trend Graphs Cascade Downwards
There’s not much positive to be said about the 12-month moving average trend graphs (see Nonresidential Construction Starts Trend Graphs - December 2020). The curves in 10 of the 12 charts are heading downwards. ‘Private offices’, ‘retail’ and ‘miscellaneous civil’ are displaying the most obvious downward trajectories. The only type-of-structure categories maintaining level paths are ‘roads/highways’ and ‘water/sewage.’
Construction Workers Not in the Vanguard for Pay Hikes
Tables B-3 and B-8 of the monthly Employment Situation report record average hourly and average weekly wages for industry sectors. B-3 is for all employees (i.e., including bosses) on nonfarm payrolls. B-8 is for ‘production and nonsupervisory personnel’ only (i.e., it excludes bosses). For ‘all jobs’ and construction, there are eight relevant percentage changes to consider.
From Table B-3 (including supervisory personnel), ‘all-jobs’ earnings y/y in December were notably buoyant, +5.1% hourly and +6.3% weekly. The compensation gains for construction workers (i.e., as a subset of ‘all jobs’) were only about half as bouncy, +2.8% hourly and +3.1% weekly. From Table B-8 (excluding bosses), the same pattern emerged. ‘All jobs’ y/y pay hikes were +5.2% hourly and +7.1% weekly. Construction workers did okay, but weren’t in the vanguard, at +2.6% hourly and +3.7% weekly.
Material Costs Soften; Bid Price Change Stays Low and Flat
November 2020’s y/y results for three BLS Producer Price Index (PPI) series were as follows: ‘construction materials special index,’ +4.9% (a step back from October’s +5.4%); ‘inputs to new construction index, excluding capital investment, labor, and imports,’ +4.5% (an easing versus October’s +5.5%); and ‘final demand construction,’ +1.2% (a level performance compared with the previous month). Bid prices and profit margins are being constrained by a shallower pool of projects going out to tender.
The value of construction starts each month is derived from ConstructConnect’s database of all active construction projects in the U.S. Missing project values are estimated with the help of RSMeans’ building cost models. ConstructConnect’s nonresidential construction starts series, because it is comprised of total-value estimates for individual projects, some of which are super-large, has a history of being more volatile than many other leading indicators for the economy.
2020/2019 ‘Grand Total’ Starts -18.3%
From Table 9 below, ConstructConnect’s total residential starts in December 2020 were -12.8% m/m, -9.5% y/y, and -2.1% ytd. The latest month’s multi-unit starts were -36.2% m/m, -62.2% y/y, and -27.6% ytd. Single-family starts were -6.8% m/m, +19.9% y/y, and +10.6% ytd. The single-family home building market is presently a clear standout among type-of-structure construction categories. 'Grand Total’ construction starts in December of 2020 were -22.7% m/m and -31.9% y/y. For full year 2020, they were -18.3%.
ConstructConnect adopts a research-assigned ‘start’ date. In concept, a ‘start’ is equivalent to ground being broken for a project to proceed. If work is abandoned or re-bid, the ‘start’ date is revised to reflect the new information.
Click here to download the Construction Industry Snapshot Package - December 2020 PDF.
Click here for the Top 10 Project Starts in the U.S. - December 2020.
Click here for the Nonresidential Construction Starts Trend Graphs - December 2020.
TABLE 6: VALUE OF UNITED STATES NONRESIDENTIAL CONSTRUCTION STARTS
DECEMBER 2020 – CONSTRUCTCONNECT
% Change | % Change | % Change | ||||
Jan-DEC 20 | Jan-DEC 20 vs | DEC 20 vs | DEC 20 vs | |||
($ billions) | Jan-DEC 19 | DEC 19 | NOV 20 | |||
Hotel/Motel | 10.160 | -56.8% | -90.2% | -80.8% | ||
Retail | 11.605 | -29.7% | -45.3% | -31.2% | ||
Parking Garage | 1.777 | -43.8% | -36.9% | -23.3% | ||
Amusement | 5.966 | -21.5% | -58.6% | -16.5% | ||
Private Office | 23.086 | -36.9% | -38.9% | -65.0% | ||
Government Office | 10.917 | -7.1% | 2.6% | 2.9% | ||
Laboratory | 2.143 | -11.3% | -29.3% | 92.4% | ||
Warehouse | 22.853 | 1.3% | -68.0% | -63.6% | ||
Miscellaneous Commercial* | 6.684 | -67.5% | -81.0% | -57.0% | ||
COMMERCIAL (big subset) | 95.191 | -34.2% | -58.1% | -53.2% | ||
INDUSTRIAL (Manufacturing) | 17.848 | -68.0% | -92.1% | -77.8% | ||
Religious | 1.454 | -23.0% | 22.9% | 99.0% | ||
Hospital/Clinic | 12.505 | -42.6% | -77.0% | -69.2% | ||
Nursing/Assisted Living | 6.969 | -27.4% | -14.9% | -27.3% | ||
Library/Museum | 3.660 | -10.1% | -48.4% | -25.6% | ||
Police/Courthouse/Prison | 8.224 | 18.5% | 69.1% | -19.1% | ||
Military | 9.154 | 81.3% | 76.0% | -63.9% | ||
School/College | 65.719 | -13.4% | -45.0% | -28.8% | ||
Miscellaneous Medical | 7.252 | -22.4% | -14.4% | 17.9% | ||
INSTITUTIONAL | 114.937 | -14.6% | -38.8% | -34.9% | ||
Miscellaneous Nonresidential | 5.445 | -29.0% | -22.1% | -23.5% | ||
NONRESIDENTIAL BUILDING | 233.420 | -31.9% | -51.1% | -44.3% | ||
Airport | 6.083 | -17.7% | -61.0% | -74.0% | ||
Road/Highway | 63.486 | -2.8% | -24.1% | -36.8% | ||
Bridge | 22.477 | -25.5% | 58.6% | 144.9% | ||
Dam/Marine | 8.221 | -3.8% | 3.3% | -51.3% | ||
Water/Sewage | 31.235 | -1.2% | -22.7% | 31.6% | ||
Miscellaneous Civil (power, pipelines, etc.) | 21.630 | -53.2% | -81.3% | -9.1% | ||
HEAVY ENGINEERING (Civil) | 153.132 | -19.1% | -39.4% | -7.8% | ||
TOTAL NONRESIDENTIAL | 386.553 | -27.3% | -46.0% | -30.9% |
*Includes transportation terminals and sports arenas.
Source: ConstructConnect Research Group and ConstructConnect.
Table: ConstructConnect.
TABLE 7: VALUE OF UNITED STATES CONSTRUCTION STARTS
CONSTRUCTCONNECT INSIGHT VERSION – DECEMBER 2020
Arranged to match the alphabetical category drop-down menus in INSIGHT
% Change | % Change | % Change | ||||||
Jan-Dec 20 | Jan-Dec 20 vs | Dec 20 vs | Dec 20 vs | |||||
($ billions) | Jan-Dec 19 | Dec 19 | Nov 20 | |||||
Summary | ||||||||
CIVIL | 153.132 | -19.1% | -39.4% | -7.8% | ||||
NONRESIDENTIAL BUILDING | 233.420 | -31.9% | -51.1% | -44.3% | ||||
RESIDENTIAL | 291.460 | -2.1% | -9.5% | -12.8% | ||||
GRAND TOTAL | 678.013 | -18.3% | -31.9% | -22.7% | ||||
Verticals | ||||||||
Airport | 6.083 | -17.7% | -61.0% | -74.0% | ||||
All Other Civil | 18.065 | -42.6% | -78.1% | 24.8% | ||||
Bridges | 22.477 | -25.5% | 58.6% | 144.9% | ||||
Dams / Canals / Marine Work | 8.221 | -3.8% | 3.3% | -51.3% | ||||
Power Infrastructure | 3.565 | -75.7% | -97.9% | -94.0% | ||||
Roads | 63.486 | -2.8% | -24.1% | -36.8% | ||||
Water and Sewage Treatment | 31.235 | -1.2% | -22.7% | 31.6% | ||||
CIVIL | 153.132 | -19.1% | -39.4% | -7.8% | ||||
Offices (private) | 23.086 | -36.9% | -38.9% | -65.0% | ||||
Parking Garages | 1.777 | -43.8% | -36.9% | -23.3% | ||||
Transportation Terminals | 2.354 | -78.1% | -84.5% | 32.0% | ||||
Commercial (small subset) | 27.217 | -46.1% | -49.6% | -61.7% | ||||
Amusement | 5.966 | -21.5% | -58.6% | -16.5% | ||||
Libraries / Museums | 3.660 | -10.1% | -48.4% | -25.6% | ||||
Religious | 1.454 | -23.0% | 22.9% | 99.0% | ||||
Sports Arenas / Convention Centers | 4.330 | -56.0% | -70.9% | -78.9% | ||||
Community | 15.411 | -34.1% | -51.4% | -31.5% | ||||
College / University | 17.014 | -13.5% | -30.3% | -27.3% | ||||
Elementary / Pre School | 19.518 | -9.0% | -49.4% | -35.8% | ||||
Jr / Sr High School | 27.262 | -17.0% | -52.6% | -24.2% | ||||
Special / Vocational | 1.924 | 0.9% | -56.0% | -43.4% | ||||
Educational | 65.719 | -13.4% | -45.0% | -28.8% | ||||
Courthouses | 2.381 | 51.9% | 1003.4% | -40.5% | ||||
Fire and Police Stations | 3.362 | 3.1% | 25.6% | -2.8% | ||||
Government Offices | 10.917 | -7.1% | 2.6% | 2.9% | ||||
Prisons | 2.480 | 17.5% | -26.1% | 66.3% | ||||
Government | 19.140 | 2.4% | 29.3% | -9.9% | ||||
Industrial Labs / Labs / School Labs | 2.143 | -11.3% | -29.3% | 92.4% | ||||
Manufacturing | 17.848 | -68.0% | -92.1% | -77.8% | ||||
Warehouses | 22.853 | 1.3% | -68.0% | -63.6% | ||||
Industrial | 42.844 | -47.0% | -74.7% | -59.9% | ||||
Hospitals / Clinics | 12.505 | -42.6% | -77.0% | -69.2% | ||||
Medical Misc. | 7.252 | -22.4% | -14.4% | 17.9% | ||||
Nursing Homes | 6.969 | -27.4% | -14.9% | -27.3% | ||||
Medical | 26.726 | -34.4% | -54.1% | -42.3% | ||||
Military | 9.154 | 81.3% | 76.0% | -63.9% | ||||
Hotels | 10.160 | -56.8% | -90.2% | -80.8% | ||||
Retail Misc. | 5.445 | -29.0% | -22.1% | -23.5% | ||||
Shopping | 11.605 | -29.7% | -45.3% | -31.2% | ||||
Retail | 27.210 | -43.0% | -69.1% | -52.6% | ||||
NONRESIDENTIAL BUILDING | 233.420 | -31.9% | -51.1% | -44.3% | ||||
Multi-Family | 71.666 | -27.6% | -62.2% | -36.2% | ||||
Single-Family | 219.795 | 10.6% | 19.9% | -6.8% | ||||
RESIDENTIAL | 291.460 | -2.1% | -9.5% | -12.8% | ||||
NONRESIDENTIAL | 386.553 | -27.3% | -46.0% | -30.9% | ||||
GRAND TOTAL | 678.013 | -18.3% | -31.9% | -22.7% |
Table 6 conforms to the type-of-structure ordering adopted by many firms and organizations in the industry. Specifically, it breaks nonresidential building into ICI work (i.e., industrial, commercial, and institutional), since each has its own set of economic and demographic drivers. Table 7 presents an alternative, perhaps more user-friendly and intuitive type-of-structure ordering that matches how the data appears in ConstructConnect Insight.
Source: ConstructConnect.
Table: ConstructConnect.
TABLE 8: VALUE OF UNITED STATES NATIONAL CONSTRUCTION STARTS – DECEMBER 2020 – CONSTRUCTCONNECT
Billions of current $s, not seasonally adjusted (NSA)
Latest month actuals | Moving averages (placed in end month) | Year to Date. | |||||||||
3-months | 12-months | JAN-dec | JAN-dec | ||||||||
oct 20 | nov 20 | dec 20 | oct 20 | nov 20 | dec 20 | oct 20 | nov 20 | dec 20 | 2019 | 2020 | |
Single Family | 23.021 | 20.025 | 18.670 | 21.641 | 21.465 | 20.572 | 17.661 | 18.058 | 18.316 | 198.781 | 219.795 |
month-over-month % change | 7.8% | -13.0% | -6.8% | 3.9% | -0.8% | -4.2% | 2.8% | 2.2% | 1.4% | ||
year-over-year % change | 33.9% | 31.1% | 19.9% | 24.2% | 29.4% | 28.5% | 9.3% | 10.8% | 10.6% | -1.8% | 10.6% |
Apartment | 6.376 | 5.134 | 3.274 | 5.880 | 5.619 | 4.928 | 6.772 | 6.422 | 5.972 | 99.042 | 71.666 |
month-over-month % change | 19.2% | -19.5% | -36.2% | -0.4% | -4.4% | -12.3% | -5.7% | -5.2% | -7.0% | ||
year-over-year % change | -43.4% | -45.0% | -62.2% | -42.1% | -44.3% | -49.5% | -16.0% | -21.8% | -27.6% | 5.1% | -27.6% |
TOTAL RESIDENTIAL | 29.397 | 25.159 | 21.944 | 27.521 | 27.084 | 25.500 | 24.433 | 24.479 | 24.288 | 297.823 | 291.460 |
month-over-month % change | 10.1% | -14.4% | -12.8% | 3.0% | -1.6% | -5.8% | 0.3% | 0.2% | -0.8% | ||
year-over-year % change | 3.3% | 2.3% | -9.5% | -0.2% | 1.5% | -1.0% | 0.9% | -0.1% | -2.1% | 0.4% | -2.1% |
Hotel/Motel | 0.552 | 1.038 | 0.200 | 0.539 | 0.670 | 0.597 | 1.150 | 1.001 | 0.847 | 23.537 | 10.160 |
month-over-month % change | 31.4% | 88.0% | -80.8% | -12.6% | 24.4% | -11.0% | -10.9% | -13.0% | -15.4% | ||
year-over-year % change | -75.3% | -63.4% | -90.2% | -70.5% | -70.7% | -74.8% | -38.0% | -48.3% | -56.8% | -10.3% | -56.8% |
Retail | 0.999 | 0.745 | 0.513 | 1.028 | 0.907 | 0.752 | 1.045 | 1.002 | 0.967 | 16.510 | 11.605 |
month-over-month % change | 2.2% | -25.4% | -31.2% | 0.8% | -11.7% | -17.1% | 0.8% | -4.1% | -3.5% | ||
year-over-year % change | 10.9% | -40.6% | -45.3% | -15.2% | -22.9% | -27.0% | -24.8% | -27.8% | -29.7% | -9.8% | -29.7% |
Parking Garages | 0.110 | 0.103 | 0.079 | 0.144 | 0.117 | 0.097 | 0.167 | 0.152 | 0.148 | 3.164 | 1.777 |
month-over-month % change | -20.3% | -6.0% | -23.3% | 0.8% | -18.7% | -16.7% | -7.4% | -8.8% | -2.5% | ||
year-over-year % change | -59.2% | -63.0% | -36.9% | -26.9% | -45.4% | -56.6% | -43.2% | -46.0% | -43.8% | 10.4% | -43.8% |
Amusement | 0.701 | 0.319 | 0.266 | 0.509 | 0.496 | 0.429 | 0.538 | 0.529 | 0.497 | 7.596 | 5.966 |
month-over-month % change | 49.8% | -54.5% | -16.5% | 26.7% | -2.5% | -13.6% | -2.1% | -1.8% | -5.9% | ||
year-over-year % change | -16.5% | -26.4% | -58.6% | -18.5% | -17.8% | -32.9% | -19.3% | -16.4% | -21.5% | -11.2% | -21.5% |
Office | 1.373 | 3.434 | 1.203 | 1.671 | 2.031 | 2.003 | 2.142 | 1.988 | 1.924 | 36.585 | 23.086 |
month-over-month % change | 6.8% | 150.1% | -65.0% | 3.4% | 21.6% | -1.4% | -8.0% | -7.2% | -3.2% | ||
year-over-year % change | -62.0% | -35.1% | -38.9% | -46.7% | -49.8% | -44.7% | -23.3% | -36.1% | -36.9% | 22.4% | -36.9% |
Governmental Offices | 0.724 | 0.757 | 0.779 | 1.137 | 1.073 | 0.754 | 0.936 | 0.908 | 0.910 | 11.749 | 10.917 |
month-over-month % change | -58.4% | 4.6% | 2.9% | -7.9% | -5.6% | -29.8% | -3.2% | -3.0% | 0.2% | ||
year-over-year % change | -33.9% | -30.8% | 2.6% | 6.5% | 3.2% | -23.4% | -5.4% | -6.4% | -7.1% | 6.7% | -7.1% |
Laboratories | 0.175 | 0.113 | 0.218 | 0.176 | 0.173 | 0.169 | 0.192 | 0.186 | 0.179 | 2.417 | 2.143 |
month-over-month % change | -24.4% | -35.2% | 92.4% | -0.4% | -1.6% | -2.6% | 3.5% | -3.0% | -4.0% | ||
year-over-year % change | 79.9% | -38.2% | -29.3% | -35.6% | -14.1% | -14.0% | 1.5% | -5.2% | -11.3% | -16.9% | -11.3% |
Warehouse | 1.781 | 1.868 | 0.681 | 1.779 | 1.699 | 1.443 | 2.041 | 2.025 | 1.904 | 22.563 | 22.853 |
month-over-month % change | 23.1% | 4.9% | -63.6% | 6.9% | -4.5% | -15.0% | 1.3% | -0.8% | -5.9% | ||
year-over-year % change | 21.8% | -9.3% | -68.0% | -8.3% | -3.0% | -23.3% | 15.3% | 14.2% | 1.3% | 3.8% | 1.3% |
Misc Commercial | 0.235 | 0.385 | 0.165 | 0.514 | 0.411 | 0.262 | 0.716 | 0.616 | 0.557 | 20.581 | 6.684 |
month-over-month % change | -61.8% | 64.0% | -57.0% | -31.8% | -19.9% | -36.4% | -9.0% | -14.0% | -9.6% | ||
year-over-year % change | -78.3% | -75.7% | -81.0% | -70.4% | -78.7% | -77.8% | -55.5% | -63.5% | -67.5% | 67.6% | -67.5% |
TOTAL COMMERCIAL | 6.650 | 8.764 | 4.105 | 7.495 | 7.578 | 6.506 | 8.927 | 8.406 | 7.933 | 144.703 | 95.191 |
month-over-month % change | -9.2% | 31.8% | -53.2% | -1.7% | 1.1% | -14.1% | -4.4% | -5.8% | -5.6% | ||
year-over-year % change | -42.6% | -41.6% | -58.1% | -37.6% | -42.8% | -46.4% | -22.7% | -29.8% | -34.2% | 8.1% | -34.2% |
TOTAL INDUSTRIAL (Manufacturing) | 2.394 | 0.578 | 0.128 | 2.429 | 1.546 | 1.033 | 1.803 | 1.612 | 1.487 | 55.810 | 17.848 |
month-over-month % change | 43.6% | -75.9% | -77.8% | 22.1% | -36.4% | -33.2% | -2.4% | -10.6% | -7.7% | ||
year-over-year % change | -18.0% | -79.8% | -92.1% | -55.2% | -31.0% | -58.2% | -61.4% | -66.5% | -68.0% | 55.9% | -68.0% |
Religious | 0.125 | 0.069 | 0.138 | 0.114 | 0.102 | 0.111 | 0.132 | 0.119 | 0.121 | 1.889 | 1.454 |
month-over-month % change | 9.9% | -44.4% | 99.0% | 10.8% | -9.8% | 8.0% | 1.7% | -9.5% | 1.8% | ||
year-over-year % change | 27.7% | -68.4% | 22.9% | -14.8% | -33.2% | -22.6% | -20.2% | -28.9% | -23.0% | -13.8% | -23.0% |
Hosptials/Clinics | 1.162 | 1.636 | 0.504 | 0.871 | 1.190 | 1.101 | 1.260 | 1.183 | 1.042 | 21.790 | 12.505 |
month-over-month % change | 50.7% | 40.7% | -69.2% | 2.2% | 36.6% | -7.5% | -7.6% | -6.1% | -11.9% | ||
year-over-year % change | -51.8% | -36.1% | -77.0% | -58.9% | -45.8% | -53.9% | -25.7% | -36.3% | -42.6% | 29.0% | -42.6% |
Nursing/Assisted Living | 0.642 | 0.534 | 0.388 | 0.651 | 0.599 | 0.521 | 0.602 | 0.586 | 0.581 | 9.599 | 6.969 |
month-over-month % change | 3.6% | -16.9% | -27.3% | 19.3% | -8.1% | -12.9% | -3.7% | -2.5% | -1.0% | ||
year-over-year % change | -30.3% | -25.3% | -14.9% | -17.5% | -33.2% | -25.2% | -29.1% | -30.5% | -27.4% | -9.6% | -27.4% |
Libraries/Museums | 0.150 | 0.145 | 0.108 | 0.182 | 0.151 | 0.134 | 0.328 | 0.313 | 0.305 | 4.072 | 3.660 |
month-over-month % change | -5.0% | -3.4% | -25.6% | -11.4% | -17.3% | -11.1% | -9.6% | -4.4% | -2.7% | ||
year-over-year % change | -73.6% | -54.7% | -48.4% | -54.0% | -67.6% | -63.3% | 0.9% | -6.6% | -10.1% | 48.2% | -10.1% |
Police/Courthouse/Prison | 0.626 | 1.061 | 0.859 | 0.755 | 0.773 | 0.849 | 0.617 | 0.656 | 0.685 | 6.940 | 8.224 |
month-over-month % change | -0.6% | 69.5% | -19.1% | 1.3% | 2.4% | 9.9% | -1.7% | 6.3% | 4.5% | ||
year-over-year % change | -16.9% | 79.1% | 69.1% | -4.3% | -1.3% | 37.3% | 1.7% | 10.3% | 18.5% | -14.5% | 18.5% |
Military | 0.985 | 1.118 | 0.404 | 0.819 | 1.020 | 0.836 | 0.710 | 0.748 | 0.763 | 5.049 | 9.154 |
month-over-month % change | 3.0% | 13.5% | -63.9% | 19.0% | 24.5% | -18.1% | 0.0% | 5.4% | 1.9% | ||
year-over-year % change | -0.4% | 69.9% | 76.0% | 19.3% | 28.1% | 33.6% | 62.4% | 71.3% | 81.3% | -3.5% | 81.3% |
Schools/Colleges | 3.993 | 4.123 | 2.936 | 4.369 | 4.021 | 3.684 | 5.703 | 5.677 | 5.477 | 75.879 | 65.719 |
month-over-month % change | 1.2% | 3.3% | -28.8% | -14.8% | -8.0% | -8.4% | -1.0% | -0.5% | -3.5% | ||
year-over-year % change | -15.2% | -7.2% | -45.0% | -13.1% | -11.9% | -23.7% | -9.1% | -9.8% | -13.4% | 6.1% | -13.4% |
Misc Government | 0.491 | 0.596 | 0.702 | 0.492 | 0.528 | 0.596 | 0.602 | 0.614 | 0.604 | 9.342 | 7.252 |
month-over-month % change | -1.3% | 21.4% | 17.9% | -0.4% | 7.3% | 12.9% | -5.6% | 2.0% | -1.6% | ||
year-over-year % change | -46.8% | 31.8% | -14.4% | -39.8% | -23.8% | -18.5% | -24.7% | -20.1% | -22.4% | -16.9% | -22.4% |
TOTAL INSTITUTIONAL | 8.173 | 9.282 | 6.039 | 8.253 | 8.382 | 7.831 | 9.954 | 9.897 | 9.578 | 134.560 | 114.937 |
month-over-month % change | 6.3% | 13.6% | -34.9% | -5.8% | 1.6% | -6.6% | -2.6% | -0.6% | -3.2% | ||
year-over-year % change | -28.1% | -6.8% | -38.8% | -23.3% | -20.5% | -24.7% | -10.7% | -12.4% | -14.6% | 4.7% | -14.6% |
Misc Non Residential | 0.513 | 0.454 | 0.348 | 0.478 | 0.472 | 0.438 | 0.498 | 0.462 | 0.454 | 7.667 | 5.445 |
month-over-month % change | 13.9% | -11.4% | -23.5% | 11.1% | -1.1% | -7.2% | -8.4% | -7.3% | -1.8% | ||
year-over-year % change | -51.7% | -48.9% | -22.1% | -36.7% | -44.4% | -45.2% | -17.7% | -27.2% | -29.0% | 6.4% | -29.0% |
TOTAL NONRES BUILDING | 17.731 | 19.078 | 10.619 | 18.654 | 17.979 | 15.809 | 21.182 | 20.377 | 19.452 | 342.740 | 233.420 |
month-over-month % change | 3.5% | 7.6% | -44.3% | -0.8% | -3.6% | -12.1% | -3.5% | -3.8% | -4.5% | ||
year-over-year % change | -34.2% | -33.6% | -51.1% | -35.5% | -33.1% | -38.7% | -24.3% | -29.0% | -31.9% | 12.2% | -31.9% |
Airports | 0.445 | 0.655 | 0.171 | 0.630 | 0.608 | 0.423 | 0.503 | 0.529 | 0.507 | 7.393 | 6.083 |
month-over-month % change | -38.6% | 47.4% | -74.0% | -11.6% | -3.6% | -30.3% | -7.9% | 5.1% | -4.2% | ||
year-over-year % change | -53.9% | 89.3% | -61.0% | -15.6% | -4.2% | -27.3% | -17.8% | -13.1% | -17.7% | 1.7% | -17.7% |
Roads/Highways | 4.995 | 5.269 | 3.330 | 4.745 | 4.764 | 4.531 | 5.269 | 5.379 | 5.290 | 65.315 | 63.486 |
month-over-month % change | 24.0% | 5.5% | -36.8% | -6.3% | 0.4% | -4.9% | 0.0% | 2.1% | -1.6% | ||
year-over-year % change | 0.5% | 33.5% | -24.1% | -7.4% | 3.4% | 2.2% | -2.1% | 0.3% | -2.8% | 3.3% | -2.8% |
Bridges | 1.081 | 1.056 | 2.585 | 1.048 | 1.024 | 1.574 | 1.865 | 1.794 | 1.873 | 30.186 | 22.477 |
month-over-month % change | 15.8% | -2.4% | 144.9% | -25.4% | -2.3% | 53.8% | -5.2% | -3.8% | 4.4% | ||
year-over-year % change | -53.1% | -44.7% | 58.6% | -56.0% | -56.1% | -19.2% | -25.7% | -29.0% | -25.5% | 25.6% | -25.5% |
Dams/Marine | 1.080 | 0.845 | 0.412 | 0.757 | 0.772 | 0.779 | 0.702 | 0.684 | 0.685 | 8.547 | 8.221 |
month-over-month % change | 177.1% | -21.7% | -51.3% | 31.1% | 1.9% | 1.0% | 0.6% | -2.6% | 0.2% | ||
year-over-year % change | 5.2% | -20.6% | 3.3% | 12.6% | -12.1% | -6.1% | 3.3% | -5.0% | -3.8% | 28.6% | -3.8% |
Water/Sewage | 2.300 | 1.863 | 2.452 | 2.711 | 2.443 | 2.205 | 2.718 | 2.663 | 2.603 | 31.617 | 31.235 |
month-over-month % change | -27.4% | -19.0% | 31.6% | -6.7% | -9.9% | -9.8% | -0.5% | -2.0% | -2.3% | ||
year-over-year % change | -6.7% | -26.2% | -22.7% | 12.9% | -4.0% | -19.0% | 8.2% | 4.7% | -1.2% | 6.7% | -1.2% |
Misc Civil | 0.897 | 1.401 | 1.274 | 1.252 | 1.005 | 1.191 | 2.321 | 2.266 | 1.802 | 46.189 | 21.630 |
month-over-month % change | 25.1% | 56.1% | -9.1% | -30.3% | -19.7% | 18.5% | -14.4% | -2.4% | -20.4% | ||
year-over-year % change | -84.0% | -32.3% | -81.3% | -80.7% | -74.5% | -75.4% | -33.0% | -32.4% | -53.2% | 43.7% | -53.2% |
TOTAL ENGINEERING | 10.799 | 11.089 | 10.223 | 11.143 | 10.616 | 10.704 | 13.378 | 13.314 | 12.761 | 189.247 | 153.132 |
month-over-month % change | 8.4% | 2.7% | -7.8% | -10.6% | -4.7% | 0.8% | -3.9% | -0.5% | -4.2% | ||
year-over-year % change | -37.7% | -6.5% | -39.4% | -37.4% | -28.9% | -30.3% | -11.7% | -11.9% | -19.1% | 16.1% | -19.1% |
GRAND TOTAL | 57.926 | 55.326 | 42.787 | 57.318 | 55.679 | 52.013 | 58.993 | 58.171 | 56.501 | 829.810 | 678.013 |
month-over-month % change | 7.7% | -4.5% | -22.7% | -1.2% | -2.9% | -6.6% | -2.0% | -1.4% | -2.9% | ||
year-over-year % change | -20.4% | -15.1% | -31.9% | -22.9% | -18.7% | -22.3% | -12.4% | -14.9% | -18.3% | 8.5% | -18.3% |
NONRES BLDG + ENGINEERING | 28.529 | 30.167 | 20.842 | 29.797 | 28.595 | 26.513 | 34.560 | 33.691 | 32.213 | 531.987 | 386.553 |
month-over-month % change | 5.3% | 5.7% | -30.9% | -4.7% | -4.0% | -7.3% | -3.7% | -2.5% | -4.4% | ||
year-over-year % change | -35.6% | -25.7% | -46.0% | -36.3% | -31.6% | -35.6% | -19.9% | -23.1% | -27.3% | 13.6% | -27.3% |
Data Source and Table: ConstructConnect.
TABLE 9: U.S. YEAR-TO-DATE REGIONAL STARTS,
NONRESIDENTIAL CONSTRUCTION* — CONSTRUCTCONNECT
JAN-DEC 2019 | JAN-DEC 2020 | % Change | |||
Connecticut | $5,200,613,970 | $3,671,994,702 | -29.4% | ||
Maine | $1,868,540,564 | $1,529,317,608 | -18.2% | ||
Massachusetts | $13,576,238,143 | $9,037,511,141 | -33.4% | ||
New Hampshire | $1,512,047,865 | $1,003,193,410 | -33.7% | ||
Rhode Island | $899,905,589 | $711,119,258 | -21.0% | ||
Vermont | $394,372,903 | $533,694,005 | 35.3% | ||
Total New England | $23,451,719,034 | $16,486,830,124 | -29.7% | ||
New Jersey | $9,107,295,823 | $7,578,541,854 | -16.8% | ||
New York | $28,871,883,235 | $19,234,666,679 | -33.4% | ||
Pennsylvania | $15,588,746,259 | $10,875,819,981 | -30.2% | ||
Total Middle Atlantic | $53,567,925,317 | $37,689,028,514 | -29.6% | ||
TOTAL NORTHEAST | $77,019,644,351 | $54,175,858,638 | -29.7% | ||
Illinois | $17,165,421,355 | $15,246,810,879 | -11.2% | ||
Indiana | $8,875,089,276 | $7,951,894,615 | -10.4% | ||
Michigan | $13,096,643,463 | $7,373,720,967 | -43.7% | ||
Ohio | $15,170,542,008 | $13,548,895,243 | -10.7% | ||
Wisconsin | $10,965,487,599 | $8,448,065,622 | -23.0% | ||
Total East North Central | $65,273,183,701 | $52,569,387,326 | -19.5% | ||
Iowa | $5,939,749,623 | $4,966,092,076 | -16.4% | ||
Kansas | $4,783,899,184 | $5,049,562,271 | 5.6% | ||
Minnesota | $10,947,586,036 | $8,559,920,212 | -21.8% | ||
Missouri | $8,084,731,603 | $9,099,611,172 | 12.6% | ||
Nebraska | $3,657,346,162 | $4,402,833,279 | 20.4% | ||
North Dakota | $2,676,576,130 | $2,389,254,991 | -10.7% | ||
South Dakota | $2,784,047,764 | $1,344,697,936 | -51.7% | ||
Total West North Central | $38,873,936,502 | $35,811,971,937 | -7.9% | ||
TOTAL MIDWEST | $104,147,120,203 | $88,381,359,263 | -15.1% | ||
Delaware | $1,121,554,889 | $1,311,208,183 | 16.9% | ||
District of Columbia | $2,109,312,778 | $880,571,934 | -58.3% | ||
Florida | $33,301,258,382 | $23,605,330,326 | -29.1% | ||
Georgia | $18,886,624,083 | $10,907,774,599 | -42.2% | ||
Maryland | $7,173,260,375 | $6,829,408,530 | -4.8% | ||
North Carolina | $17,727,934,563 | $10,006,070,459 | -43.6% | ||
South Carolina | $7,282,135,251 | $5,236,694,633 | -28.1% | ||
Virginia | $14,912,459,108 | $10,604,371,923 | -28.9% | ||
West Virginia | $1,849,963,165 | $2,432,595,894 | 31.5% | ||
Total South Atlantic | $104,364,502,594 | $71,814,026,481 | -31.2% | ||
Alabama | $8,167,284,371 | $5,187,550,566 | -36.5% | ||
Kentucky | $6,786,289,146 | $5,321,337,248 | -21.6% | ||
Mississippi | $2,716,659,530 | $2,763,041,582 | 1.7% | ||
Tennessee | $8,737,345,332 | $7,916,084,769 | -9.4% | ||
Total East South Central | $26,407,578,379 | $21,188,014,165 | -19.8% | ||
Arkansas | $3,654,382,903 | $4,226,111,936 | 15.6% | ||
Louisiana | $8,517,297,471 | $4,571,855,191 | -46.3% | ||
Oklahoma | $5,464,676,888 | $4,221,156,643 | -22.8% | ||
Texas | $87,309,332,003 | $48,606,249,018 | -44.3% | ||
Total West South Central | $104,945,689,265 | $61,625,372,788 | -41.3% | ||
TOTAL SOUTH | $235,717,770,238 | $154,627,413,434 | -34.4% | ||
Arizona | $9,858,533,484 | $7,601,065,321 | -22.9% | ||
Colorado | $11,339,489,727 | $6,705,296,699 | -40.9% | ||
Idaho | $2,166,361,572 | $1,472,293,404 | -32.0% | ||
Montana | $2,022,492,348 | $1,568,190,805 | -22.5% | ||
Nevada | $6,462,310,653 | $3,415,053,770 | -47.2% | ||
New Mexico | $2,828,871,899 | $2,364,315,163 | -16.4% | ||
Utah | $5,539,993,453 | $6,482,161,945 | 17.0% | ||
Wyoming | $5,340,726,315 | $985,400,464 | -81.5% | ||
Total Mountain | $45,558,779,451 | $30,593,777,571 | -32.8% | ||
Alaska | $1,069,937,686 | $1,476,348,841 | 38.0% | ||
California | $41,447,921,452 | $38,393,082,049 | -7.4% | ||
Hawaii | $2,137,648,369 | $1,999,812,380 | -6.4% | ||
Oregon | $6,077,916,927 | $4,357,987,985 | -28.3% | ||
Washington | $18,810,222,827 | $12,546,870,175 | -33.3% | ||
Total Pacific | $69,543,647,261 | $58,774,101,430 | -15.5% | ||
TOTAL WEST | $115,102,426,712 | $89,367,879,001 | -22.4% | ||
TOTAL U.S. | $531,986,961,504 | $386,552,510,336 | -27.3% |
*Figures above are comprised of nonres building and engineering (i.e., residential is omitted).
Data Source and Table: ConstructConnect.
About Alex Carrick
Alex Carrick is Chief Economist for ConstructConnect. He has delivered presentations throughout North America on the U.S., Canadian and world construction outlooks. Mr. Carrick has been with the company since 1985.