Top 10 Construction Starts by Dollar Volume: December 2024
ConstructConnect reports the top ten nonresidential construction starts monthly in the Construction Economy Snapshot from Michael Guckes Chief...

It Starts with Government Spending
Public spending and infrastructure have a long and extensive relationship. The Public Works Administration, part of the New Deal in 1933 and a response to the Great Depression of 1928, formalized the modern-day large-scale public works that have changed America for the better. Every day, Americans enjoy arguably the world’s largest public works project in recorded history when they use the Interstate Highway System.
Many such projects came at considerable cost, but the returns on many of these projects continue to pay dividends to generations of citizens long after those who originally built them. This then raises the question: with all the investment spending in recent years, why would two of the world’s premier credit-ratings agencies now give America a credit rating of less than the highest possible “AAA” rating? Considering that a large portion of this spending is put toward construction, it naturally raises another question: what are the implications of America’s credit rating on the construction sector?
The Cost of Growth
Over the last 20 years, US GDP has more than doubled from $11.2 trillion to $26.8 trillion. However, US public debt increased nearly five-fold over that same period from $6.5 trillion in 2003 to today’s $31.5 trillion as of March 2023. The most benign way to see this may be to suggest that to support and grow the economy by $14 trillion over the last 20 years, the government had to support it with $25 trillion of additional support. Therefore, before considering interest expense, the government received $0.50 in return for every dollar spent. This, however, would fail to factor in the non-quantifiable, non-tangible benefits of such spending, including, for example, the security that such spending brings to America and its allies.
Under this line of thinking, one could reason that the true or “total social” return per public dollar borrowed does generate a positive return. Yet even if so, the financial math has determined that continued spending this way is impossible. The government’s long history of financial over-commitments is coming to an end, hastened by even modest interest rate increases.
A Measure of Severity
The ratio of public debt to GDP —at approximately 1:1— is often used as a gauge to determine just how severe is the nation’s debt problem. This may lead many to believe that the government is like a household with a family income of $70,000 and a debt of $70,000, but thanks to a pristine credit score providing them a rock-bottom interest rate. In this example, the monthly income would be $5,800/mo. and the debt would cost only around $107/mo.--many would envy such a situation. However, this example falls woefully short of reality as the government’s income isn’t the size of the economy (GDP) but rather the sum of its receipts which amounted to only about 18% of GDP in 2022. In our example, then, the proper measure of the government’s income would be $12,600 per year or $1,050 per month. Returning to the household example, the family now spends about 10% of its monthly income on debt payments.
Mandatory Spending Impact
However, there is yet another factor to include in our household model. Our model must account for the fact that the government must cover its mandatory spending obligations each year. Mandatory spending are expenses that by law must be paid for, including public healthcare, social security and income security, including food stamps and childcare assistance. In 2022 mandatory spending consumed 84% of all receipts. In our household model, $879 of our $1,050 in monthly income must be set aside, leaving the family with less than $171 each month to make that $107 debt payment. This leaves the family with a mere $64 each month remaining from their original $1,050 to cover important monthly necessities.
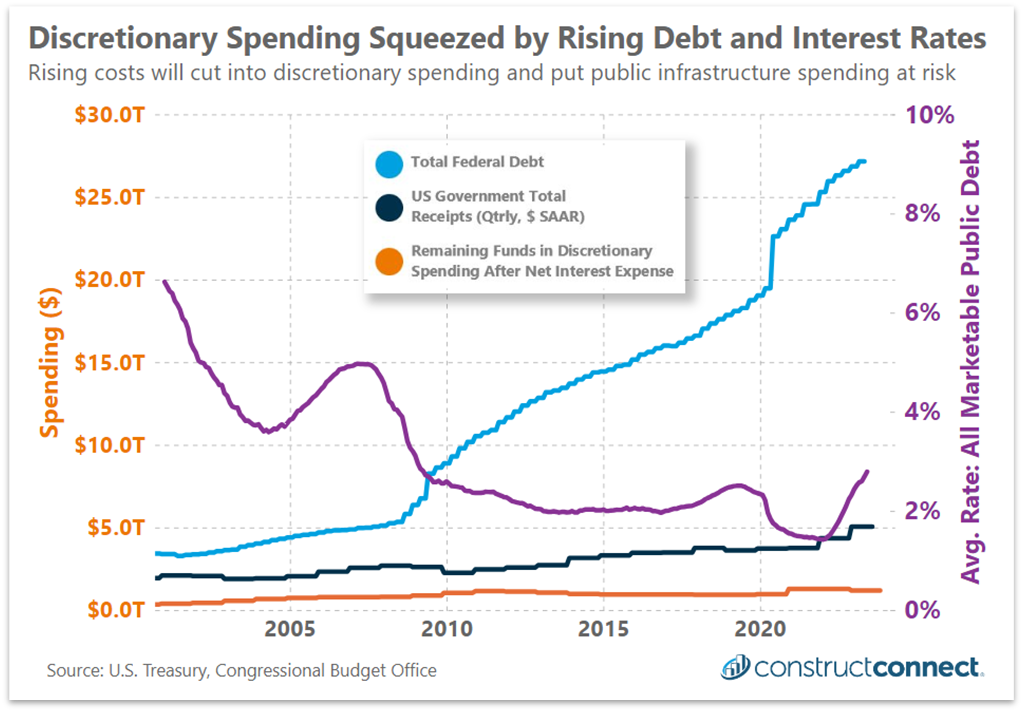
The Squeeze
Applying the household example to actual government figures, that thin cushion of cash (orange line) available to pay the debt (light blue line) is becoming exceedingly thin. Furthermore, any fluctuation in mandatory spending, or the interest rate paid on that debt (purple line), could easily consume more of that thin cushion. America was fortunate that between 2007 and 2022, the average rate the government paid on its debt continually declined. Unfortunately, since the beginning of 2022, that rate has doubled from a pandemic low of 1.4% to a 14-year high of 2.8% now. As the government’s financial position has become more untenable, its credit rating has rightfully been diminished, raising the prospect that the interest rate it pays to turn over its debts will move higher, making that cushion even more precarious.
The Impact on Construction
In 2022, the total income of the government ($4.9T) less its mandatory spending requirements ($4.1T) and debt payments ($0.5T) left the government with only $300M to spend on all of its non-mandatory spending, including defense, education, public health and transportation among many others. However, the government could spend an additional $1.4T on discretionary items through borrowing and increasing its total debt level. These borrowed funds constituted 80% of the year’s discretionary spending. In other words, four out of every five dollars spent on roads, schools, military facilities, and the other infrastructure that drive the construction sector was made possible only through public borrowing.
Public Debt Issues May Migrate
There are seemingly no realistic scenarios under which the government can maintain its current spending and tax habits. The Congressional Budget Office (CBO) forecasts that interest payments on the public debt will consume all non-discretionary spending by 2031, followed two years later by the collapse of social security, which will no longer be able to cover its full obligations. This leaves raising taxes and reducing spending as the country’s only option. Both situations will shrink the economy, but a reduction in spending would be particularly painful for the construction sector, which will have to battle for dollars from those who would prioritize education and defense spending. Everyone would also pay more to borrow as interest rates in the private sector are calculated at a premium to public debt rates. As America’s credit rating drops, treasury rates will increase and ultimately increase borrowing rates in the private sector.
How the construction sector feels the impact of this future fiscal reality will be multifaceted:
In both scenarios, construction firms will want to ensure they are properly diversified, with private projects constituting most of their revenues. Even here, though, private development will struggle as higher tax rates and higher interest rates reduce expected returns on investment, leaving only those projects with the best prospects of moving from blueprint to reality.
ConstructConnect reports the top ten nonresidential construction starts monthly in the Construction Economy Snapshot from Michael Guckes Chief...
ConstructConnect reports the top ten nonresidential construction starts monthly in the Construction Economy Snapshot from Michael Guckes Chief...
ConstructConnect reports the top ten nonresidential construction starts monthly in the Construction Economy Snapshot from Michael Guckes Chief...
ConstructConnect reports the top ten nonresidential construction starts monthly in the Construction Economy Snapshot from Michael Guckes Chief...