After five consecutive years of increases in the number of construction worker deaths, construction industry fatalities in private industry fell 2% from 2016 to 2017, according to the 2017 Census of Fatal Occupational Injuries (CFOI) from the Bureau of Labor Statistics (BLS) released yesterday.
The construction industry again had the highest number of fatalities of all industries with 971 worker deaths. The construction industry represented 20.8% of all private industry worker deaths in 2017.
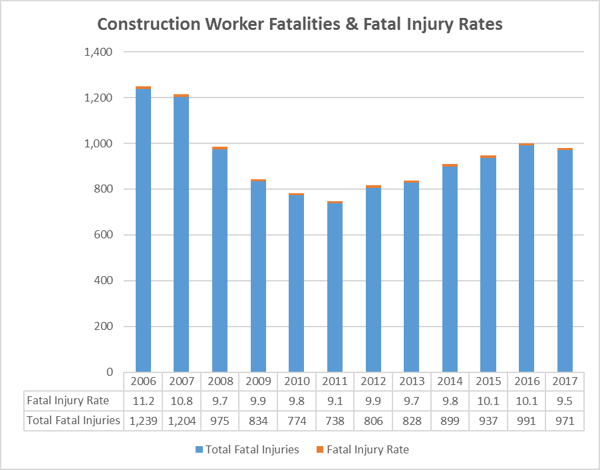
The fatal injury rate for the construction industry fell to 9.5 in 2017 from 10.1 the previous year. For all workers, the fatal injury rate decreased from 3.6 in 2016 to 3.5 in 2017. The fatal injury rate is calculated as the number of fatal occupations injuries per 100,000 full-time equivalent (FTE) workers.
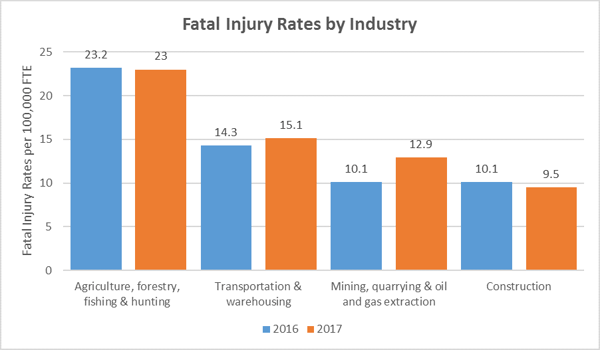
Despite accounting for the highest number of worker deaths, the construction industry only had the fourth highest fatal injury rate among all industries. Agriculture, forestry, fishing, and hunting had a fatal injury rate of 23.0 per 100,000 FTE followed by transportation and warehousing at 15.1, and mining, quarrying, and oil and gas extraction at 12.9.
The Five Deadliest Jobs in 2017 by Fatal Work Injury Rates
So, which occupations are the deadliest to work in? Because the number of workers in each occupation varies, looking at the jobs with the highest fatal injury rates is the best way to determine which jobs are the deadliest.
- Fishers and related fishing workers - 99.8 fatal injuries per 100,000 FTE workers (41 deaths)
- Logging workers - 84.3 (55 deaths)
- Aircraft pilot and flight engineers - 48.6 (59 deaths)
- Roofers - 45.2 (91 deaths)
- Refuse and recyclable material collectors - 35.0 (30 deaths)
These were the same occupations that claimed the top five spots in 2016, with fishers and related fishing workers overtaking logging workers for the top spot. Fishers and related fishing workers were the only occupations to see an increase in their fatal injury rate last year, all others saw a decrease in 2017.
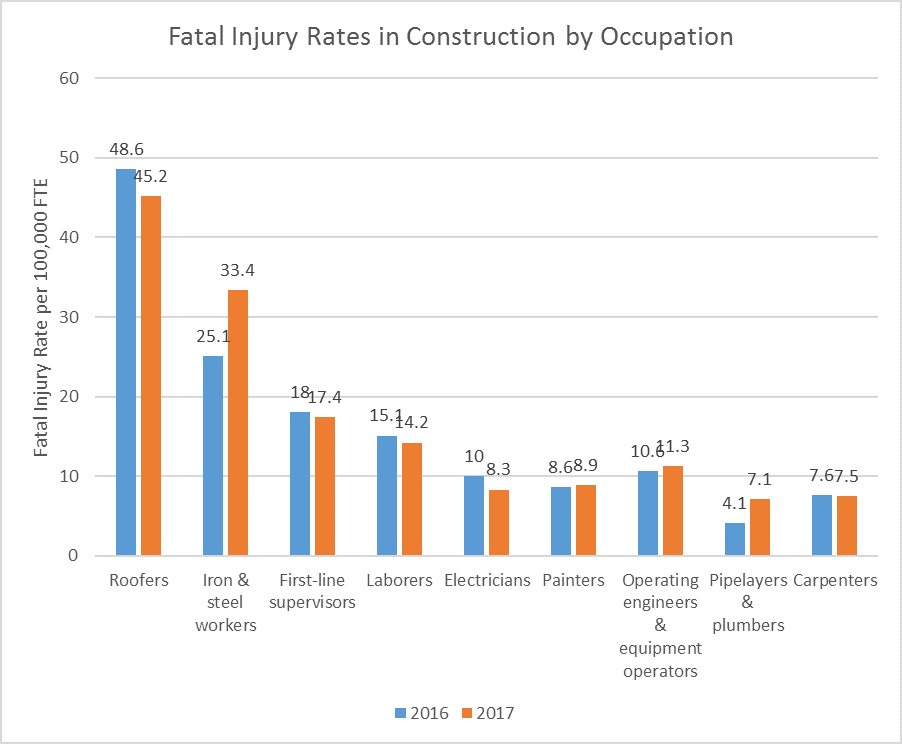
Structural iron and steel workers in construction were sixth on the list with a fatal injury rate of 33.4, accounting for 14 worker deaths in 2017. Other occupations in construction with high fatal injury rates include first-line supervisors of construction trades and extraction workers (121 deaths) at 17.4, construction trades helpers at (11 deaths) at 15.7, and construction laborers (259 deaths) at 14.2.
Construction Worker Deaths by Fatal Injury Rates
Many occupations in construction saw a decrease in fatal injury rates in 2017. First-line supervisors dropped from 18.0 to 7.4, carpenters dropped from 7.6 to 7.5, and construction laborers dropped from 15.1 to 14.2. Electricians dropped from 10.0 to 8.3 and roofers decreased from 48.6 to 45.2.
Occupations that saw an increase in fatal injury rates in 2017 included operating engineers and other construction equipment operators going from 10.6 to 11.3, painters increasing from 8.6 to 8.9, and pipelayers, plumbers, pipefitters, and steamfitters increasing from 4.1 to 7.1. Structural iron and steel workers rose from 25.1 to 33.4.

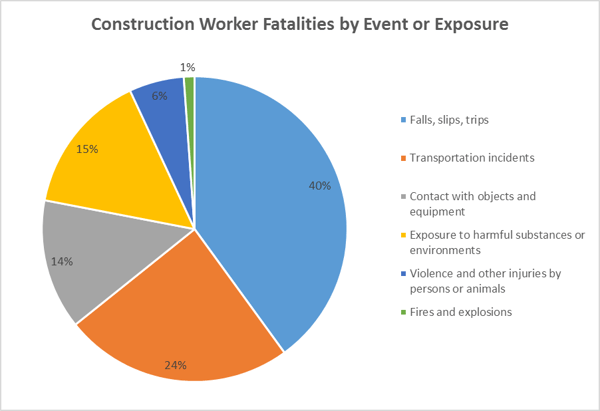
Construction Worker Deaths by Event or Exposure
OSHA’s Fatal Four
In the construction industry, the four leading causes of worker deaths not involving highway collisions were falls, being struck by objects, electrocutions and getting caught-in/between objects. OSHA has dubbed these the Fatal Four as they were responsible for 60.45% of all construction worker deaths in 2017.
Falls - 386 out of 971 total construction worker deaths in 2017 (38.7%)
Struck by Object - 80 (9.4%)
Electrocutions - 71 (8.3%)
Caught-in/between - 50 (7.3%)
Except for falls, there was a decrease in total construction worker deaths for each of the Fatal Four in 2017.
Falls
Most of the worker deaths from falls, 366 of them, were falls to a lower level with only 15 occurring from falls on the same level. Falls from a collapsing structure or equipment were responsible for 26 deaths and 59 deaths were attributed to falls through a surface or existing opening. Another 273 worker deaths were classified as other falls to a lower level.
These other falls to lower levels occurred at heights from less than 6 feet all the way up to falls from more than 30 feet:
- Other fall to lower level less than 6 feet - 10 deaths
- Other fall to lower level 6 to 10 feet - 36 deaths
- Other fall to lower level 11 to 15 feet - 69 deaths
- Other fall to lower level 16 to 20 feet - 40 deaths
- Other fall to lower level 21 to 25 feet - 31 deaths
- Other fall to lower level 26 to 30 feet - 21 deaths
- Other fall to lower level more than 30 feet - 40 deaths
Exposure to Harmful Substances or Environments
Of the 145 construction worker deaths attributed to exposure to harmful substances or environments, 71 were from exposure, both direct and indirect, to electricity.
- Direct exposure to electricity, 220 volts or less - 18 deaths
- Direct exposure to electricity, greater than 220 volts - 29 deaths
- Indirect exposure to electricity, 220 volts or less - 5 deaths
- Indirect exposure to electricity, greater than 220 volts - 19 deaths
Exposure to other harmful substance led to 59 construction worker deaths last year, 46 of those were due to unintentional overdoses from the use of nonmedicinal drugs or alcohol. Exposure to environmental heat was responsible for 12 construction worker deaths in 2017.
Contact with Objects and Equipment
Contact with objects and equipment led to 133 fatal injuries to construction workers in 2017. These events encompass two of the Fatal Four: struck by injuries and caught-in/between injuries.
Of the 80 fatal struck by injuries to construction workers, 23 were from being struck by a powered vehicle not used for transportation and 44 were from falling objects or equipment other than powered vehicles.
There were 15 deaths caused by construction workers getting caught in or compressed by equipment or objects. Another 19 construction worker deaths were attributed to excavation or trenching cave-ins and 15 were the results of workers getting struck, caught, or crushed by some other collapsing structure or equipment.
Transportation Incidents
The other major leading cause of construction worker deaths was transportation incidents which accounted for 234 deaths in 2017, down from 246 fatalities in 2016.
Most of these deaths were from roadway incidents involving motor vehicles: 63 due to collisions with other vehicles, 49 due to collisions with an object other than another vehicle, and 38 due to a noncollision incident such as a jack-knifed or overturned vehicle. Of the 59 pedestrian vehicular fatal injuries to construction workers, 34 occurred in work zones.
Other Events or Exposures
Violence and other injuries by persons or animals resulted in 56 construction worker deaths in 2017. There were 22 deaths caused by intentional injuries by another person and 25 deaths caused by suicides on the jobsite.
There were 15 construction worker deaths caused by fires or explosions. Of those, 15 were attributed to explosions and 3 attributed to fires.
Primary Sources of Construction Worker Deaths
To better understand the major events and exposures that lead to construction worker deaths each year, it helps to look at some of the primary sources that cause those fatal injuries.
For example, when looking at the high number of construction worker deaths from falls we can look at some of the primary sources such as roofs (121 deaths), ladders (71 deaths), scaffolds (54 deaths), and floors, walkways, and ground surfaces (47 deaths) to better understand what caused these fatal occupational injuries.
For electrocutions, we see that 41 deaths were caused by electrical parts, with 19 due to electrical wiring in buildings and 20 attributed to power lines, transformers, and converters.
Most transportation incidents were due to motor vehicles (211), with 105 deaths caused by freight hauling and utility trucks and another 82 from multipurpose highway vehicles like pick-ups (69) and SUVs (12).
Machinery was the primary source of 81 worker deaths in 2017. Construction equipment like excavating machines (22 worker deaths) and road grading and surfacing machinery (16 worker deaths) were some of the leading sources.
Drug and alcohol use, especially when it comes to the growing opioid epidemic, is a major concern for the construction industry. Of the occupational deaths to construction workers in 2017, 46 were due to drugs, alcohol, and medicines with 20 deaths attributed to nonmedicinal drugs and 17 due to a combination of multiple drugs, alcohol, and medicines.
Final Thoughts
While a 2% drop in construction worker deaths isn’t a historic decrease, it only amounted to 20 fewer worker deaths from the previous year, it could be a step in the right direction. Up until last year, the number of construction worker deaths had been steadily increasing.
The industry has added over 1.46 million jobs during that time, so it seemed to reason that the numbers would continue to increase. A drop in the numbers, regardless of the amount, can be seen as a big, if temporary, win for the construction industry.
Construction owners still have a long way to go to improving overall safety on the jobsite to reduce the number of accidents leading to serious injuries and death. Hopefully, the drop in construction worker deaths in 2017 is the first of many in the years to come.