Top 10 Construction Starts by Dollar Volume: February 2025
ConstructConnect reports the top ten nonresidential construction starts monthly in the Construction Economy Snapshot from Michael Guckes Chief...

ConstructConnect announced today that February 2023’s volume of construction starts, excluding residential work, was $33.0 billion, a decrease of -42.4% versus January 2023’s figure of $57.2 billion (originally reported as $57.0 billion).
February failed to match January for number or dollar volume of megaprojects. But that wasn’t the whole explanation for the month-to-month starts drop-off. It seems higher interest rates are finally taking a bite out of the array of mid- and smaller-sized projects that are being advanced by owners to the groundbreaking stage.
Click here to download the complete Construction Industry Snapshot Package - March 2023 PDF.
Injecting a cheerier note, total nonresidential starts in this year’s February were +11.6% compared with the same month last year. And year-to-date, total nonresidential starts have been +41.8% versus January-February 2022.
In the latest month, there were two projects carrying estimated values of more than a billion dollars each (i.e., the definition of a megaproject), expansion work at JFK Airport in New York and a solar power project in Riverside, California. On a month-to-month comparison basis, however, February’s $3.6 billion of mega project work paled next to January’s $14.6 billion. January’s megaproject list featured an aluminum plant in Alabama, a hospital in Indiana, and, largest of all, a new LNG facility in Port Arthur, Texas.
Leaving aside megaprojects in both months, February’s total nonresidential starts were -31.0% compared with January.
A new wrinkle has been added to elevated interest rates as a source of worry about the outlook coming from the financial side of the economy. There’s been the high-profile failure of a couple of American banks, SVB and Signature, with the threat of contagion spreading to other institutions around the world. Washington has stepped in quickly to forestall bank runs by assuring all depositors that they will be able to withdraw their funds. Nevertheless, there’s a natural tendency to wonder about the degree to which today’s banking crisis compares with 2008-09.
The differences are profound. Initial problems in the earlier period arose from an asset class that is now under closer oversight, subprime mortgages. High-risk activities undertaken by what were then known as investment banks brought about the collapse of all seven of them so that they are no longer wild cards. The remaining biggest banks, under tighter regulation, are now backstopped by more formidable capitalization requirements, policed by stress tests.
And there is a factor that is often overlooked. For a string of years, several countries in Europe, most notably Greece, were hovering on the edge of bankruptcy. The global banking system was under threat from potential sovereign debt defaults. If central banks keep raising interest rates, this may become an issue again, but for the moment, it’s not screaming from the headlines.
Other statistics often beloved by analysts are trailing twelve-month results, and these are set out for all the various type-of-structure categories in Table 9.
Grand Total TTM starts in February, on a month-to-month basis, contracted slightly, -0.7%. In January, they had been +1.7%, and in December, at the end of last year, +1.6%.
On a year-over-year basis, Grand Total TTM starts in February were still assertively positive, +17.2%, although they weren’t quite as strong as in either January, +19.6%, or December, +18.9%.
To complete the overview picture, the GRAND TOTAL dollar volume (i.e., adding residential to nonresidential activity) of starts in February 2023 was -34.6% m/m and -11.2% y/y, but +7.8% YTD.
Starts compile the total estimated dollar value and square footage of all projects on which ground is broken in any given month. They lead, by nine months to as much as two years, put-in-place statistics from the Census Bureau, which are analogous to work-in-progress payments as the building of structures proceeds to completion.
PIP numbers cover the universe of construction, new plus all manner of renovation activity, with residential traditionally (i.e., over the decade preceding the pandemic) making up two-fifths (about 40%) of the total, and nonresidential, three-fifths (i.e., the bigger portion, at around 60%).
In 2021 and 2022, there were dramatic changes in the proportional shares of the total put-in-place dollar volumes taken by residential versus nonresidential. In 2021’s full-year PIP results, the relationship was about half and half, with residential at 49.4% and nonresidential, at 50.6%. In 2022, residential finally broke through the longstanding barrier and claimed the larger share of the total, 50.7% to 49.4% for nonresidential.
This new relationship, given the higher interest rate regime, could not be expected to hold. Higher interest rates, which harm affordability, have an almost immediate negative impact on housing demand. True to historical form, residential’s share of total in January of the current year softened to 48.5%. In January 2022, they accounted for 51.1% of the total.
The reported PIP numbers from the Census Bureau are always a month behind the starts data. The total dollar volume of put-in-place construction in January of this year was +5.0% versus January 2022. Residential’s -6.1% was more than offset by nonresidential’s +16.5%.
Nonresidential’s leading subsector for year-over-year percentage change was manufacturing, +54.8%. Next in line was lodging, +41.7%, but the year-over-year comparison was lifted by a low base figure in January 2022. Three infrastructure subcategories all recorded gains of about +16%—highway and street; sewage and waste disposal; and water supply.
PIP numbers, being more spread out, have smaller peak-over-trough percent-change amplitudes than the starts series. As an additional valuable service for clients and powered by its extensive starts database, ConstructConnect, in partnership with Oxford Economics, a world leader in econometric modeling, has developed put-in-place construction statistics by types of structure for U.S. states, cities, and counties, actuals and forecasts. ConstructConnect’s PIP numbers are released quarterly and are featured in a separate reporting system.
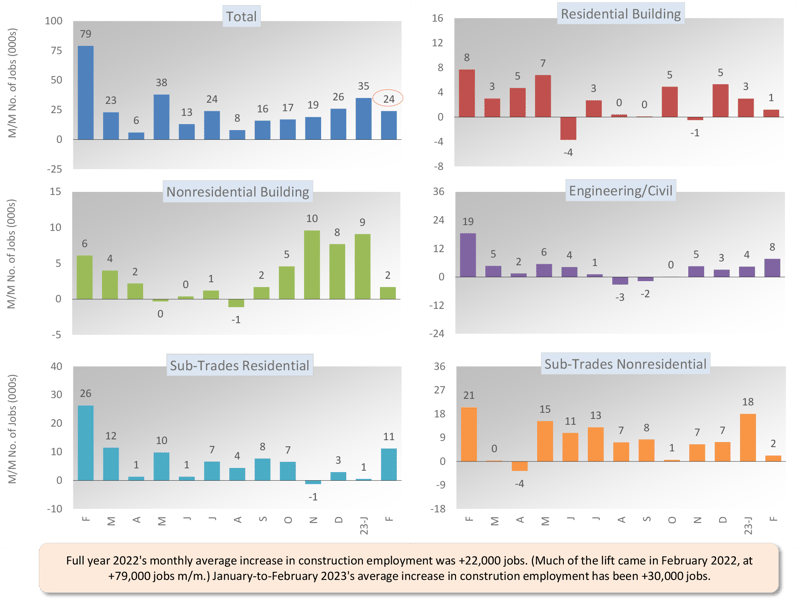
Construction’s share of U.S. total non-farm employment in the monthly labor market report issued by the Bureau of Labor Statistics is slightly more than 5.0%. Accordingly, to claim its share of February’s +311,000 economy-wide number-of-jobs advance, the figure for construction would have needed to be +16,000. Instead, it was a better-performing +24,000 jobs.
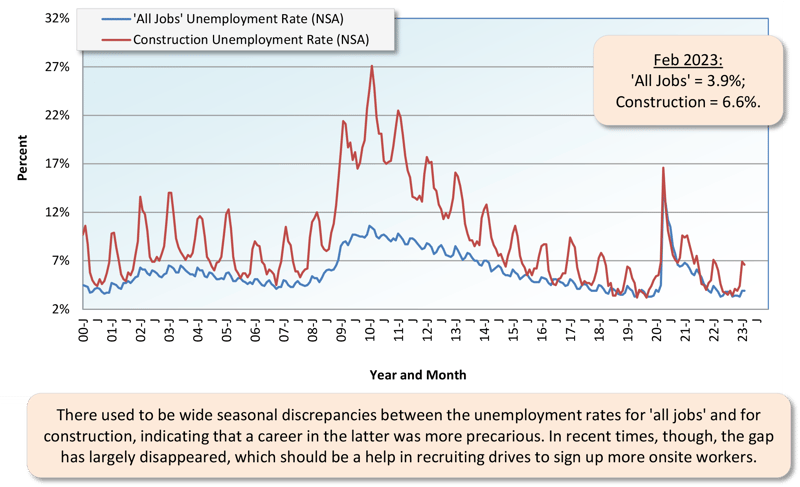
Construction’s not seasonally adjusted unemployment rate in February was 6.6%, down from January’s 6.9%, and a little below year-ago February’s 6.7%.
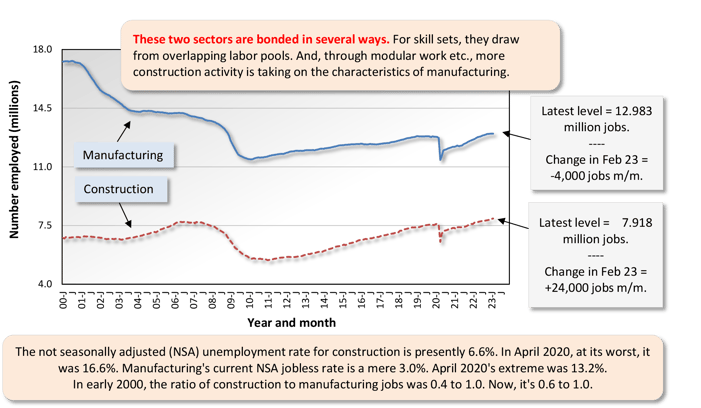
February’s NSA U rate for construction of 6.6% was higher than the nation’s all jobs figure of 3.9%. It was also above manufacturing’s 3.0%. Both the manufacturing and construction sectors are in the goods-producing segment of the economy (i.e., as opposed to services-producing), and there is considerable overlap between their labor pools. Manufacturing, though, recorded a contraction in number of positions in the latest month, shedding -4,000 jobs.
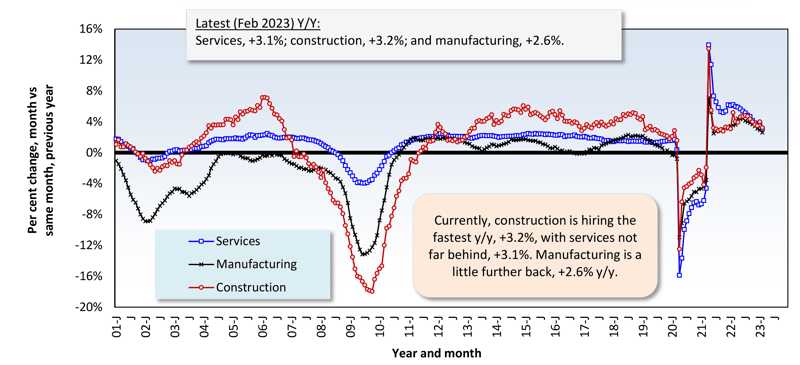
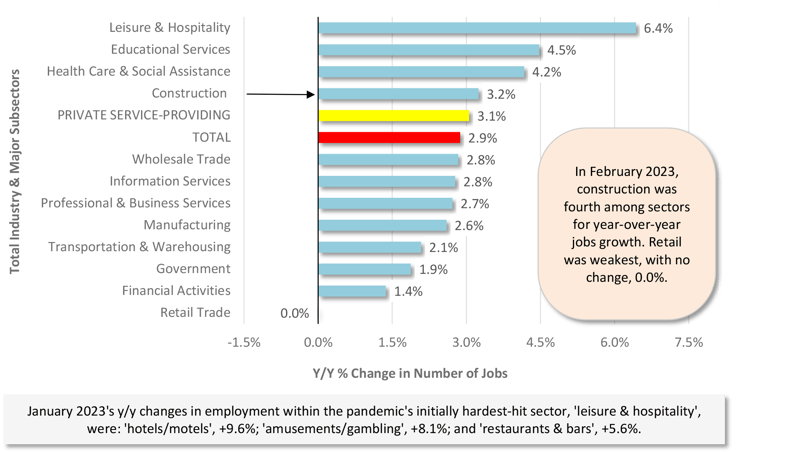
In February, U.S. construction pulled off a faster rate of year-over-year jobs growth, at +3.2%, than the economy as a whole, +2.9%; manufacturing, +2.6%; and total private services-providing firms, +3.1%. The leader among industries was leisure and hospitality, +6.4%.
In other segments of the economy with close ties to construction, February 2023’s y/y percentage changes in employment were as follows: oil and gas exploration and development, +5.5%; architectural and engineering design services, +4.8%; cement and concrete product manufacturing, +4.5%; machinery and equipment rental and leasing, +4.4%; real estate, +2.8%; and building materials and supplies dealers, -1.5%.
Since design services work at architectural and engineering firms leads naturally to construction activity in the field, the +4.8% gain for jobs growth in the sector strikes a pleasing note. Furthermore, it’s encouraging that the Architecture Billings Index from the American Institute of Architects moved up to 49.3 in January from 48.4 in December. The text in the latest ABI press release says that “new project work has begun to increase.” (For reference, a figure of 50.0 is the pivot point for the ABI. Below it, revenues for design firms are shrinking; above it, they’re expanding.)
Graph 1: Change in Level of U.S. Construction Employment, Month to Month (M/M) − Total & by Categories - Febuary 2023
Graph 2: U.S. Manufacturing Versus Construction Employment - February 2023 - Seasonally Adjusted Payroll Data
Graph 3: U.S. Unemployment Rates: All Jobs & Construction - February 2023 (Not Seasonally Adjusted)
Graph 4: U.S. Employment - February 2023 - % Change Y/Y (Seasonally Adjusted)
Graph 5: U.S. Total & Subsectors Y/Y Jobs Change - February 2023 (Seasonally Adjusted)
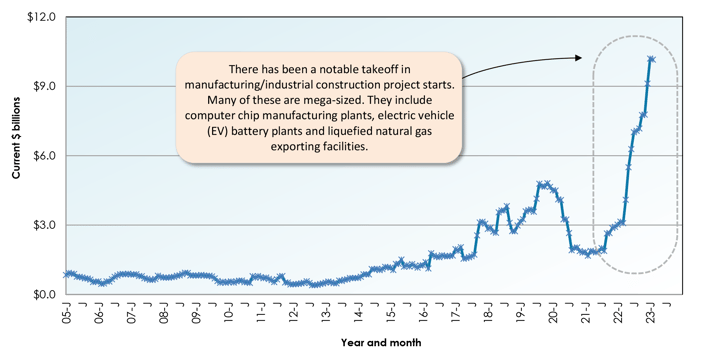
Graph 6: U.S. Manufacturing Construction Starts - ConstructConnect (12-Month Moving Averages)
The -42.4% month-to-month (m/m) drop in February’s total nonresidential starts resulted from large declines in the industrial (-89.4%), institutional (-43.4%), and engineering (-20.7%) subcategories. Only commercial (+5.0%) managed an improvement.
The +11.6% pickup in the dollar volume of total nonresidential starts in February 2023 versus February 2022 (y/y) was thanks to gains by engineering (+29.9%) and institutional (+10.6%). Industrial (-25.4%) acted as a drag, and commercial (-1.4%) played a neutral role.
On a year-to-date basis through the first two months of 2023, total nonresidential starts remained well ahead of January-February 2022. Industrial, filled to the brim with LNG work in January, was +239.4%. Institutional (+47.6%) and engineering (+28.8%) were also bright sparks. Commercial (-3.6%) struggled a bit.
Usually, about a third of all nonresidential starts derive from just two type-of-structure designations, roads/highways and schools/colleges. Their shares of total so far in 2023, at 16.8% and 13.2%, respectively, have added to a little less than normal, 30.0%.
The three percentage-change metrics for street starts in February were -30.1% m/m, but +14.7% y/y and +39.3% YTD. For educational facility starts, the results in the latest month were -21.8% m/m, but +33.5% y/y and +32.1% YTD. Further, with respect to educational facilities, pre-school/elementary starts have forged ahead most dramatically, +44.4%.
Important beyond roads within the engineering sub-category are water/sewage and bridge starts. The results for the former in February were -22.6% m/m, but +33.1% y/y and +24.3% YTD. For the latter, they were -38.5% m/m and -0.4% y/y, but +9.5% YTD.
February’s three metrics for miscellaneous civil starts, which include power, railroad, and pipeline components, were up across the board: +34.3% m/m; +63.5% y/y; and +9.0% YTD.
Important beyond schools in institutional are three medical sub-categories, i.e., hospitals/clinics, nursing/assisted living, and miscellaneous medical. Their combined starts in February were -72.1% m/m and -43.2% y/y, but +53.0% YTD. The dollar volume of hospital project starts on their own year-to-date has been +157.8%.
The military subcategory generated two outstanding percentage-change results in February, +374.4% y/y and +739.9% YTD.
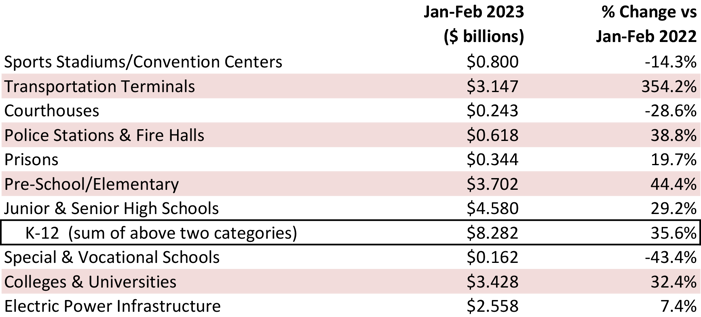
Among commercial subcategories, only hotel/motel (+53.6%) and miscellaneous (+245.7%) were up m/m in February. As for YTD results, the only gains were recorded by government offices (+71.3%), laboratories (+39.5%), and miscellaneous (+142.7%), which includes transportation terminals (+354.2%).
Table 2: Construction Starts in Some Additional Type of Structure Subcategories
The results with respect to work opportunities in the construction industry, as reported in January’s Jobs Openings and Labor Turnover Survey report, have knocked analysts for a loop. In a single month, the number of openings was cut in half (from 488,000 to 248,000, equaling -240,000), by far the sharpest decline in the history of the data series. Some moderation was expected, due to new home construction fading in the face of higher interest rates. But a -50% turnabout is hard to credit, especially since the month before (December 2022) saw the biggest m/m upward leap in the number of openings (+140,000) in the history of the series.
Before jumping too far into the bushes to explain these developments, waiting for another month’s worth of data seems justified, to rule out the possibility of a false count or other statistical anomalies.
This Industry Snapshot sets out the history, from January 2005 to the present, of 12-month moving ConstructConnect starts averages for a dozen construction types of structures. The moving-average approach is designed to capture trends. (As a technical note, the moving average is graphed at the ending month.)
The slopes of many of the graphs, especially those pertaining to engineering work, are still clearly heading higher. Substantial dollar amounts made available by Washington are driving infrastructure undertakings. In nonresidential building, however, ongoing upticks in schools and hospitals are contending with further down draughts by private offices and retail.
Tables B-3 and B-8 of the monthly Employment Situation report, from the BLS, record average hourly and average weekly wages for industry sectors. B-3 is for all employees (i.e., including bosses) on nonfarm payrolls. B-8 is for production and nonsupervisory personnel only (i.e., it excludes bosses). For all jobs and construction, there are eight relevant percentage changes to follow.
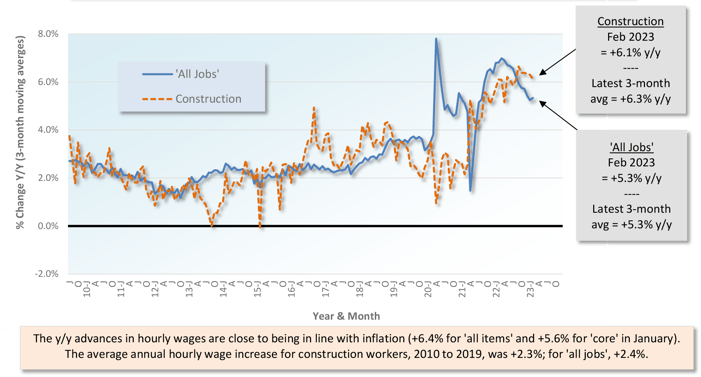
From February 2023’s Table B-3 (including bosses), y/y all-jobs earnings were +4.6% hourly and +4.0% weekly. Compensation hikes for construction workers, as a subset of all jobs, were better, at +5.5% hourly and +6.9% weekly. From Table B-8 for production and non-supervisory workers (i.e., excluding bosses), the y/y all-jobs paycheck advances were +5.3% hourly and +4.4% weekly. Those substantial gains, though, were once again eclipsed by construction workers whose wages sped ahead by +6.1% y/y hourly and +5.3% y/y weekly.
Graph 9: Average Hourly Earnings Y/Y - All Jobs & Construction
Graph 10: Average Weekly Earnings Y/Y - All Jobs & Construction
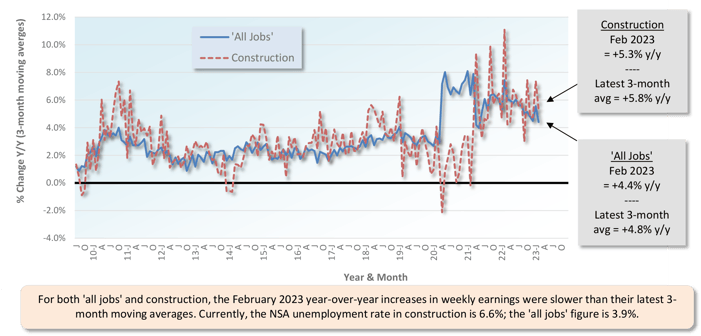
Table 3: 2023 YTD Ranking of Top 20 States by $ Volume of Nonresidential Construction Starts — ConstructConnect®
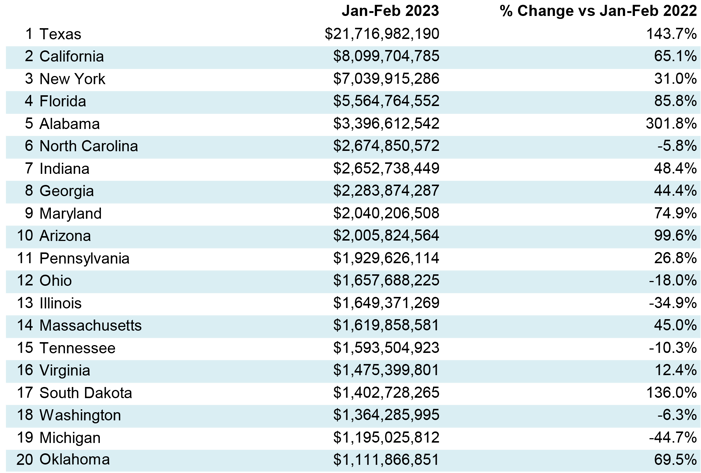
Table 4: 2023 YTD Ranking of Top 20 States by $ Volume of Nonresidential Building Construction Starts — ConstructConnect®
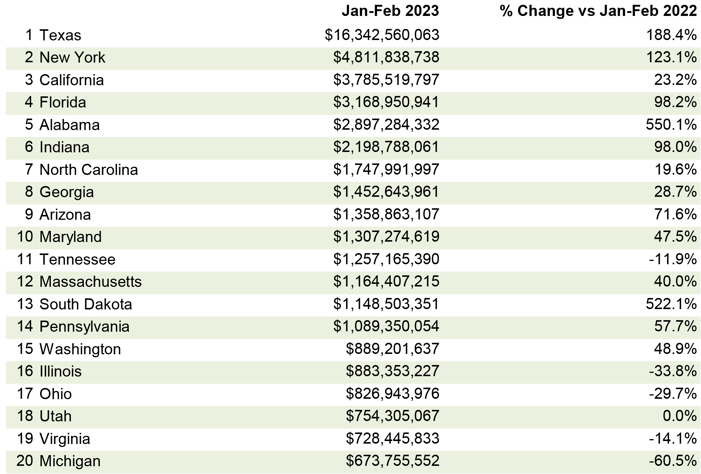
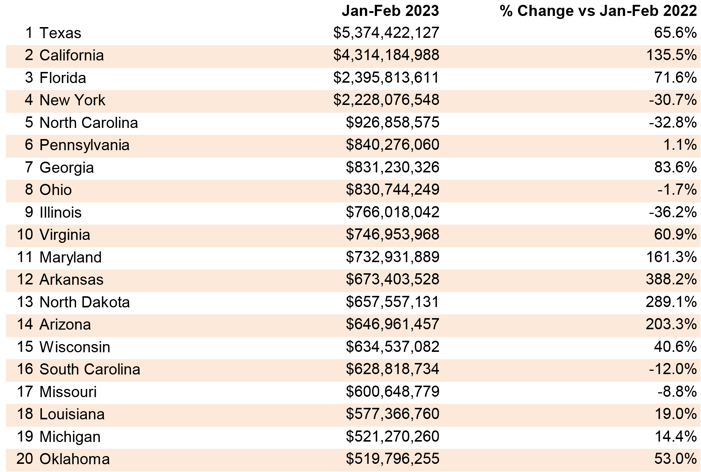
Table 5: 2023 YTD Ranking of Top 20 States by $ Volume of Heavy Engineering/Civil Construction Starts — ConstructConnect®
February 2023’s y/y results for three building-related BLS Producer Price Index series were: (A) construction materials special index, -5.3% (a further decline from January’s -3.8%); (B) inputs to new construction index, excluding capital investment, labor, and imports, +3.4% (a small jog up from the previous month’s +0.7%); and (C) final demand construction, designed to capture bid prices, +16.2% (not much moderation from +16.7% in the period prior).
(A) comes from a data series with a long history, but it’s confined to a limited number of major construction materials. (B) has a shorter history, but it’s more comprehensive in its coverage, although it includes some items (e.g., transportation) that aren’t strictly materials.
There are also PPI indices for specific construction inputs. Continuing to show y/y increases are: cement, +15.0%; ready-mix concrete, +12.3%; gypsum, +11.7%; and diesel fuel, +4.8%. Exhibiting y/y declines are hot rolled steel bars, plates, and structural shapes, -6.5%; aluminum mill shapes, -9.6%; asphalt, -20.4%; and, in a freefall, softwood lumber, -45.1%. Copper wire and cable are creeping sideways, +0.4%. Also, there’s an inputs to highways and streets index, +3.5% y/y.
The value of construction starts each month is derived from ConstructConnect’s database of all active construction projects in the United States. ConstructConnect’s nonresidential construction starts series, because it is comprised of total-value estimates for individual projects, some of which are super-large, has a history of being more volatile than many other leading indicators for the economy.
ConstructConnect’s total residential starts in February 2023 were -13.8% m/m, -34.9% y/y, and -30.2% YTD. Multi-family starts were -33.7% m/m, -35.9% y/y, and -23.9% YTD. Single-family starts were flat (0.0%) m/m, -34.5% y/y, and -33.3% YTD. There’s not a lot of diversity in those percent change figures; they’re nearly all off by a third.
Including home building with all nonresidential categories, Grand Total starts in February 2023 were -34.6% m/m and -11.2% y/y, but +7.8% YTD.
ConstructConnect adopts a research-assigned start date. In concept, a start is equivalent to ground being broken for a project to proceed. If work is abandoned or rebid, the start date is revised to reflect the new information.
Challenging news seems to be overwhelming recent headlines, with January’s U.S. construction jobs opening data registering a near 50% decline in the course of a single month. Following almost immediately afterward was news of Amazon’s plans to cancel, close, or delay almost 100 existing or planned logistics facilities. Such headlines may appear to be only the latest in a seemingly continual stream of difficult industry news; however, the fundamentals of the nonresidential and civil segments of the industry remain on—or above—their long-run growth trajectories. Therefore, recent modest and momentary negative headlines should not overshadow the fundamental strength of the industry.
At the end of February, the number of employed persons in construction was up 3.3% since just the start of the year. More importantly, the number of construction workers has increased steadily over the last two-and-a-half years by more than 11%, representing a 4.4% compounded annual rate of growth. When compared to the overall national employment growth level, construction employment levels have been growing a full percentage point faster.
The outlook for construction spending continues to outpace overall economic growth, according to quantitative data collected by industry experts. Construction starts data, put-in-place data, and conceptualized spending data all continue to indicate growth that is at or above its long-run trend.
Nonresidential put-in-place spending is projected to increase by an annualized 7.2% from 2023 through 2025, more than double the expected growth of the overall U.S. economy. Similarly, recent months of data evaluating the level of newly planned projects as compared to a year ago levels suggests that nonresidential and civil construction could see a near 20% increase in nominal construction spending.
U.S. public construction spending serves as a backstop to construction demand because it is generally unaffected by economic cycles. As of January 2023, the seasonally adjusted annualized level of public construction spending exceeded $383 billion.
Over the last 10 years, such spending has grown at a compounded annual rate of 3.6%. Future years of public spending should only be expected to accelerate due to the recent passage of multiple pieces of legislation and in particular, the Infrastructure Investment and Jobs Act.
Over the coming decade, the IIJA alone is expected to increase public construction spending by $550 billion. If spent evenly across this time horizon, it would result in a 14% increase in annual public construction compared to today. Other critical infrastructure and security bills, such as the CHIPS and Science Act, will both directly and indirectly fund additional construction spending.
Each of the above elements offers a brief glimpse of the strength of the supply and demand fundamentals that are shaping the construction industry of the present, as well as the future. As such, sensational headlines pointing to brief but volatile changes in the industry need to be appropriately weighted in light of the industry’s longer-trend performance. - Michael Guckes, Senior Economist
A rule of thumb is that nonresidential construction is a lagging indicator among economic measures. Companies are hesitant to undertake capital spending until their personnel needs are rapidly expanding and their office square footage or plant footprints are straining capacity. Plus, it helps if profits are abundant.
The rule doesn’t always hold true, however. For example, under present circumstances, weakness in some (mainly cyclical) areas of construction investment may well be offset by rich veins of large industrial and engineering projects to be unearthed.
Each month, ConstructConnect publishes information on upcoming construction projects at its Expansion Index.
The Expansion Index, for hundreds of cities in the United States and Canada, calculates the ratio, based on dollar volume, of projects in the planning stage, at present, divided by the comparable figure a year ago. The ratio moves above 1.0 when there is currently a larger dollar volume of construction prospects than there was last year at the same time. The ratio sinks below 1.0 when the opposite is the case. The results are set out in interactive maps for both countries.
Click here to download the Construction Industry Snapshot Package - March 2023 PDF.
Click here for the Top 10 Project Starts in the U.S. - February 2023.
Click here for the Nonresidential Construction Starts Trend Graphs - February 2023.
ConstructConnect reports the top ten nonresidential construction starts monthly in the Construction Economy Snapshot from Michael Guckes Chief...
Below are six graphs recording 12-month moving averages of ConstructConnect’s nonresidential construction starts.
ConstructConnect Chief Economist Michael Guckes provides a monthly update on construction employment, wages, and hiring.
Michael Guckes, Senior Economist at ConstructConnect, helps industry leaders navigate the ever-changing economic landscape of the construction...