Planned Construction Spending Remained Upbeat Through October
ConstructConnect's Expansion Index shows a 22% increase in the total dollar value of U.S. planned construction projects in October 2022 from a year...

ConstructConnect announced today that October 2022’s volume of construction starts, excluding residential work, was $47.5 billion, a decline of -8.2% compared with September’s figure of $51.7 billion (originally reported as $51.1 billion).
The month-to-month decrease came despite October being another excellent month for mega-sized project initiations. (Megaprojects carry an estimated value of a billion dollars or more each.) October’s three super-big projects summing to $9.4 billion, however, weren’t quite a match for September’s four outsized projects, adding to $14.2 billion.
/industry-snapshot_nov_2022.jpg)
View this information as an infographic.
Click here to download the complete Construction Industry Snapshot Package - October 2022 PDF.
The latest month’s largest undertakings were a new EV car plant and battery manufacturing complex in Georgia, an ammonia production facility in Texas, and a giant general hospital in Massachusetts.
October’s three megaprojects did lift the total for the year to $83.8 billion from 25 projects. With two more months still to go in 2022, that already establishes a new annual record. The previous peak year for megas occurred in 2019 when the total was $79.1 billion from 35 projects.
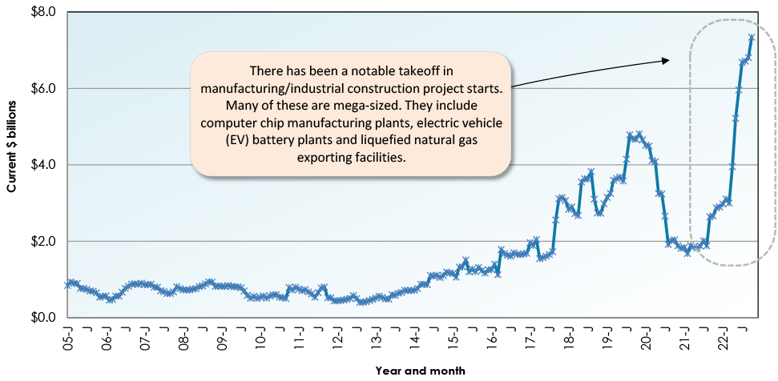
Also noteworthy is that the average estimated value for megaproject starts has risen substantially, from $2.3 billion three years ago to $$3.2 billion in the current year. Estimators are factoring in higher input costs. Plus, the nature of the biggest projects has changed. Today’s chip manufacturing plants, greenfield site battery production lines, and LNG exporting facilities, are huge undertakings.
October 2022’s total dollar volume of nonresidential construction starts was up by +42.2% when compared with October 2021. On a year-to-date basis, total nonresidential starts have been +30.8% versus January to October of last year.
To complete the starts picture, the GRAND TOTAL (i.e., adding residential to nonresidential activity) in October 2022 was -1.3% m/m, +21.8% y/y and +16.9% YTD.
There are three major subcategories of total starts: residential, nonresidential building, and heavy engineering/civil. On a year-to-date percentage-change basis in October, nonresidential building starts turned in the best record, +34.9%. Heavy engineering/civil also managed an exemplary increase, +24.2%. Only residential failed to impress, +0.4%.
On a month-to-month basis in October, though, it was residential (+12.3%) doing better than both nonresidential buildings (-6.4%) and engineering (-11.7%).
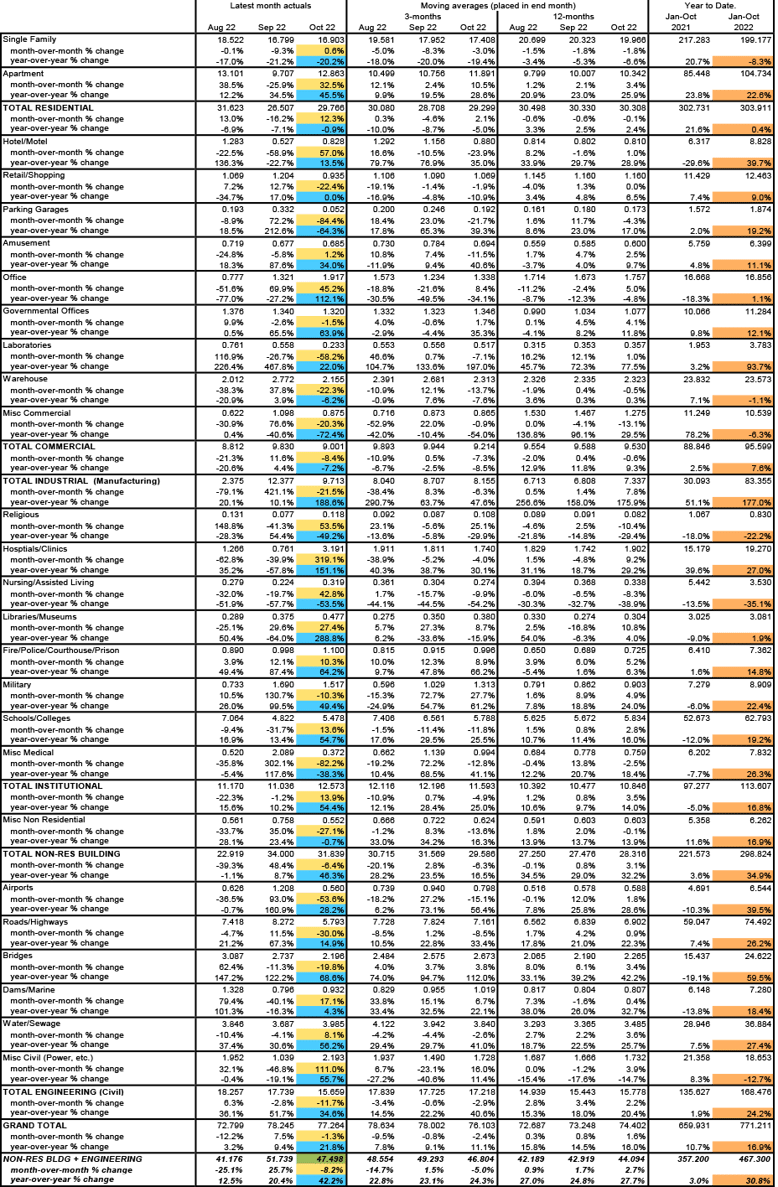
Other statistics often beloved by analysts are trailing 12-month results and these are set out for all the various type-of-structure categories in Table 10.
Grand Total TTM starts in October, at +1.6% on a month-to-month basis, forged ahead nicely. They picked up speed from September’s +0.8% and August’s +0.3%.
On a year-over-year basis in October, Grand Total TTM starts also performed well, +16.0%, but they weren’t dramatically different from September’s +14.5%. They were even less of a standout when compared with August’s +15.8%.
Starts compile the total estimated dollar value and square footage of all projects on which ground is broken in any given month. They lead, by nine months to as much as two years, put-in-place statistics which are analogous to work-in-progress payments as the building of structures proceeds to completion.
PIP numbers cover the universe of construction, new plus all manner of renovation activity, with residential traditionally making up two-fifths (about 40%) of the total and nonresidential, three-fifths (i.e., the bigger portion, at around 60%).
Over the past several years, however, there has been an eye-popping change in the ratio. In 2021’s full-year PIP results, the residential to nonresidential relationship was about half and half. Through October of this present year, 2022, residential now claims a 52.5% share of the total, with nonresidential holding the other 47.5%.
The January-September 2022 over January-September 2021 total dollar volume of PIP construction was +11.4%. Residential, at +18.8% ytd, was still far ahead of nonresidential, +4.2% ytd. But the latter included at least one sub-category that was making an attention-grabbing statement, manufacturing at +28.3% ytd.
PIP numbers, being more spread out, have smaller peak-over-trough percent-change amplitudes than the starts series. As an additional valuable service for clients and powered by its extensive starts database, ConstructConnect, in partnership with Oxford Economics, a world leader in econometric modeling, has developed put-in-place construction statistics by types of structure for U.S. states, cities, and counties, actuals, and forecasts. ConstructConnect’s PIP numbers are being released quarterly and are featured in a separate report.
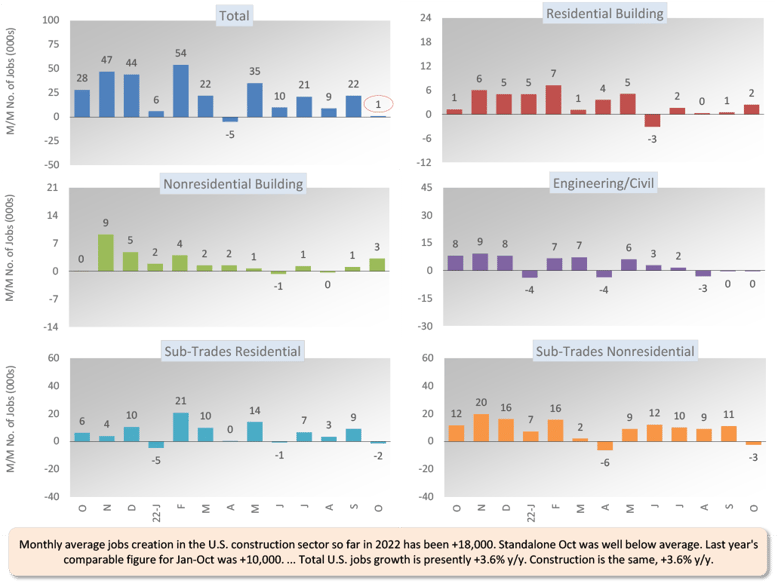
Construction’s share of U.S. total nonfarm employment in the monthly labor market report issued by the Bureau of Labor Statistics is slightly more than 5.0%. To claim its proportional share of October’s economywide number-of-jobs increase of +261,000, the figure for construction would have needed to be +13,000. Instead, it was a disappointing +1,000.
Nevertheless, the monthly average increase in construction employment through the first ten months of this year has been +18,000. This is beating last year’s comparable figure of +10,000.
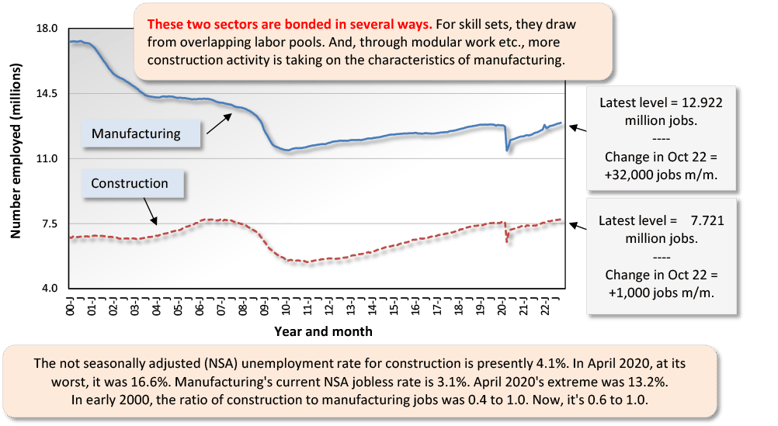
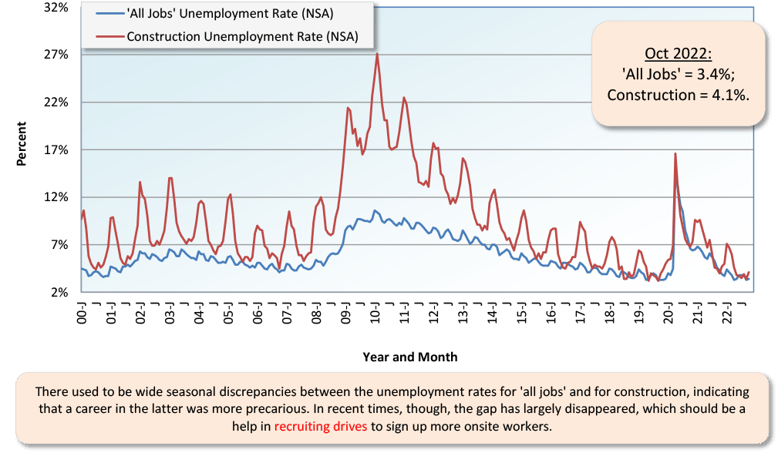
Construction’s not seasonally adjusted unemployment rate in October was 4.1%, up somewhat from September’s 3.4%, but about on a par with October of last year’s 4.0%. The latest reading of 4.1% is a little above the nation’s all jobs NSA U rate of 3.4%.
Manufacturing’s current NSA U rate is 3.1%. Both the manufacturing and construction sectors are in the goods-producing segment of the economy (i.e., as opposed to services-producing) and there is considerable overlap between their labor pools.
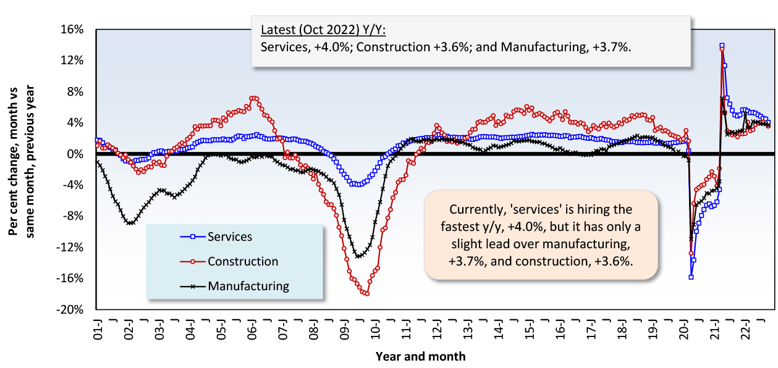
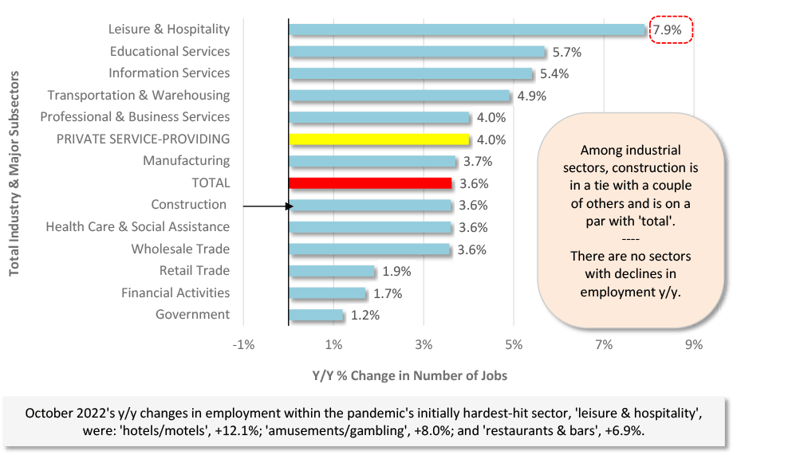
In the latest month, the U.S. construction sector achieved the same year-over-year advance in number of employees as all jobs, +3.6%. The staffing increase by manufacturers was a tad speedier, +3.7% y/y. Private sector services employment rose at an even faster clip, +4.0% y/y. Among all services sub-sectors, leisure and hospitality scored the greatest y/y pickup in jobs count, +7.9%, but that’s after being scarred most severely by the coronavirus pandemic.
In other segments of the economy with close ties to construction, the latest y/y percentage changes in employment have been as follows: oil and gas exploration and development, +11.8%; architectural and engineering design services, +5.9%; machinery and equipment rental and leasing, +3.4%; real estate, +2.5%; cement and concrete product manufacturing, +2.4%; and building materials and supplies dealers, -2.1%. The latter is being influenced by a tailing off in residential new and reno activity, coincident with rapidly climbing mortgage rates.
Design services work at architectural and engineering firms leads into later onsite activity. Therefore, the +5.9% jobs jump for the industry is a positive sign concerning future in-the-field and mainly nonresidential employment. Offering lukewarm support is the Architecture Billings Index from the American Institute of Architects. The ABI in September, at 51.7, stayed above its key 50.0 benchmark, but it was down from August’s 53.3 figure. (For the ABI, above or below 50.0 is the demarcation point that separates more from fewer sales month to month.) The AIA’s New Project Inquiries index also retreated in the latest month, to 53.6.
Graph 1: Change in Level of U.S. Construction Employment, Month to Month (M/M) −
Total & by Categories - October 2022
Graph 2: U.S. Manufacturing Versus Construction Employment - October 2022 - Seasonally Adjusted (SA) Payroll Data
Graph 3: U.S. Unemployment Rates: All Jobs & Construction - October 2022 (Not Seasonally Adjusted)
Graph 4: U.S. Employment - October 2022 - % Change Y/Y (Seasonally Adjusted)
Graph 5: U.S. Total & Subsectors Y/Y Jobs Change - October 2022 (Seasonally Adjusted)
Graph 6: U.S. Manufacturing Construction Starts - ConstructConnect (12-Month Moving Averages)
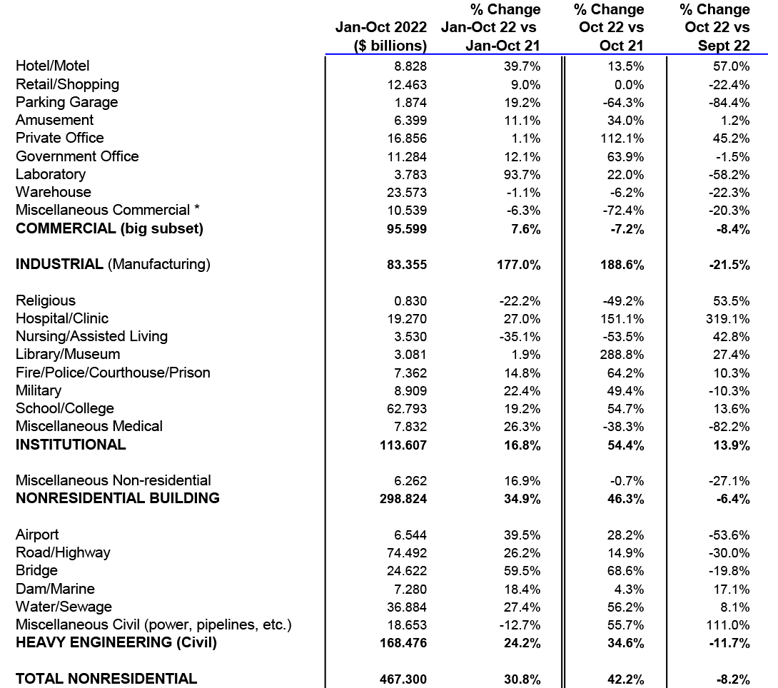
The -8.2% month-to-month (m/m) change in October’s total nonresidential starts resulted from declines in nearly all the major type of structure subcategories. Industrial was -21.5%; engineering, -11.7%; and commercial, -8.4%. Only institutional showed improvement, +13.9%.
The +42.2% gain in total nonresidential starts in October of this year versus October of last year (y/y) was thanks to big pickups in industrial (+188.6%), institutional (+54.4%), and engineering (+34.6%). Only commercial took a step backwards (-7.2%).
October’s +30.8% year-to-date (YTD) advance in total nonresidential starts garnered support from all points along the type-of-structure spectrum, led by industrial, +177.0%, and followed by engineering, +24.2%; institutional, +16.8%; and commercial, +7.6%.
There are two dominant subcategories of total nonresidential starts. When the volumes of roads/highways and schools/colleges are added together, they accounted for 29.3% of October’s total nonresidential starts YTD (i.e., shares of 15.9% and 13.4% respectively).
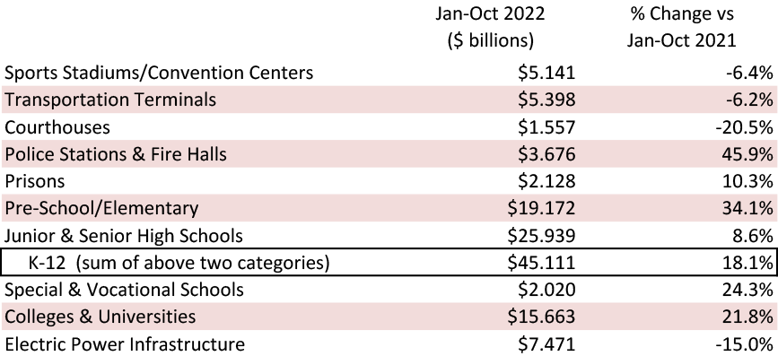
The three percentage-change metrics for street starts in October 2022 were -30.0% m/m, but +14.9% y/y, and +26.2% YTD. For educational facility starts, the results were all commendable: +13.6% m/m, +54.7% y/y and +19.2% YTD. At the various levels of education, preschool and elementary work have accounted for the biggest uptick in starts year to date, +34.1%.
Important beyond roads within the engineering subcategory are water/sewage and bridge starts. The results for the former in October were +8.1% m/m; +56.2% y/y; and +27.4% YTD. For the latter, a -19.8% performance m/m lost its sting next to surges of +68.6% y/y and +59.5% YTD.
Important beyond schools in institutional are three medical subcategories – i.e., hospitals/clinics, nursing/assisted living, and miscellaneous medical. Their combined starts in October 2022 were +26.3% m/m, +51.7% y/y, and +14.2% YTD. On their own, hospital/clinic starts in the latest month were +319.1% m/m, +151.1% y/y, and +27.0% YTD.
Also showing good results within institutional so far this year have been the police station/fire hall (+45.9% YTD) and military (+22.4% YTD) subcategories of starts.
Among commercial starts in October, laboratories (+93.7%) led the YTD charge, with hotels/motels (+39.7%), government office buildings (+12.1%), amusement (+11.1%), and retail/shopping (+9.0%) in tow. Interestingly, private office buildings and warehouses have fought back from significant weakness earlier this year to now reside on nearly level planes, +1.1% and -1.1% respectively, both YTD.
Finally, there are industrial starts, which faltered m/m in October (-21.5%) but were outstanding y/y (+188.6%) and YTD (+177.0%). While the latest month featured a couple of huge industrial project startups, their combined dollar volume fell short of what was commissioned in manufacturing last month. September included a $9 billion chipmaking facility for Samsung in Texas.
Table 2: Construction Starts in Some Additional Type of Structure Subcategories
This Industry Snapshot sets out the history, from January 2005 to the present, of 12-month moving ConstructConnect starts averages for a dozen construction types of structures. The moving-average approach is designed to capture trends. (As a technical note, the moving average is graphed in the ending month.)
During 2022, the nonresidential building and heavy engineering curves have both been moving higher in solid fashion. Institutional is now trending upwards more clearly than commercial.
Looking further into subcategories, schools/colleges, hospitals/clinics, roads/highways, water/sewage, and bridges all have starts trend lines that are rising. Private office buildings and miscellaneous civil are stepping sideways.
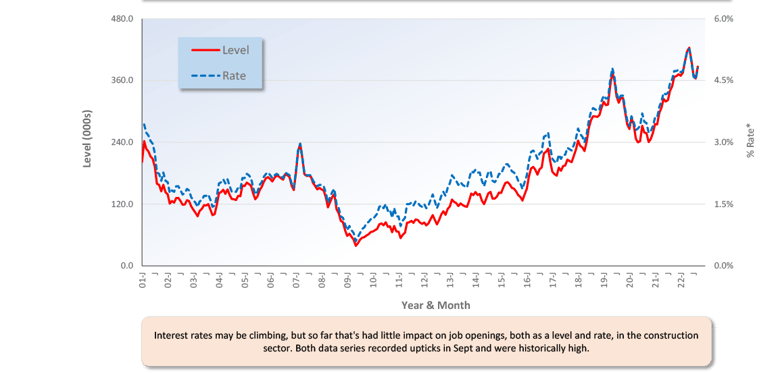
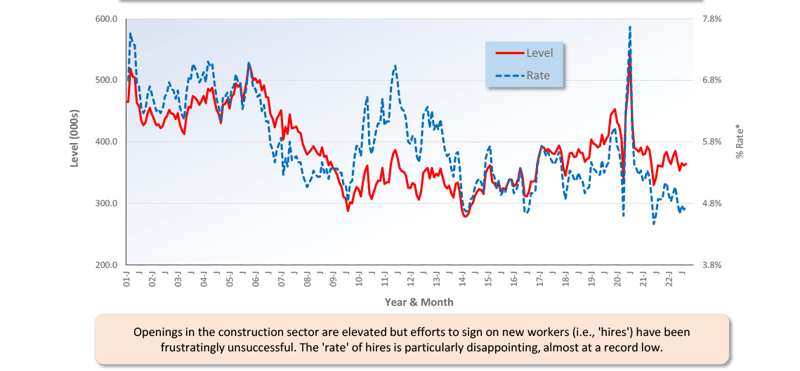
For ease of viewing, Graphs 7 and 8 show smoothed curves (i.e., based on three-month moving averages) for the Job Openings and Labor Turnover Survey results pertaining to construction industry openings and hires.
For the construction sector, the JOLTS story remains frustrating. There are multiple openings, but there’s been only limited success in filling positions. One might suppose that sizable wage hikes would supply a solution. But construction worker earnings have lifted off (see next section) and there hasn’t been much of an impact on sign-ups. The industry will need to become more assertive in promoting other incentives, appealing to a wider potential-employee base, and dreaming up ways to adopt more automation or make switchovers to modular.
Graph 7: U.S. Construction Job Openings (from JOLTS Report)
(3-month Moving Averages placed in Latest Month)
Graph 8: U.S. Construction Job Hires (from JOLTS Report)
(3-month Moving Averages placed in Latest Month)
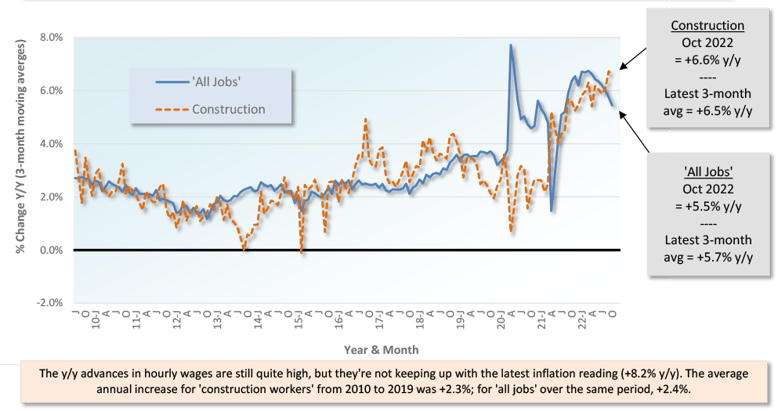
Tables B-3 and B-8 of the monthly Employment Situation report, from the BLS, record average hourly and average weekly wages for industry sectors. B-3 is for all employees (i.e., including bosses) on nonfarm payrolls. B-8 is for production and nonsupervisory personnel only (i.e., it excludes bosses). For all jobs and construction, there are eight relevant percentage changes to spotlight.
From October 2022’s Table B-3 (including bosses), y/y all-jobs earnings were +4.7% hourly and +3.8% weekly. Construction workers, as a subset of all jobs, did better on both counts, +5.6% hourly and +5.8% weekly. From Table B-8 for production and non-supervisory workers (i.e., excluding bosses), the y/y all-jobs paycheck advances were +5.5% hourly and +4.8% weekly. Again, construction workers were rewarded more richly, +6.6% hourly and +7.1% weekly.
Graph 9: Average Hourly Earnings Y/Y - All Jobs & Construction
Graph 10: Average Weekly Earnings Y/Y - All Jobs & Construction
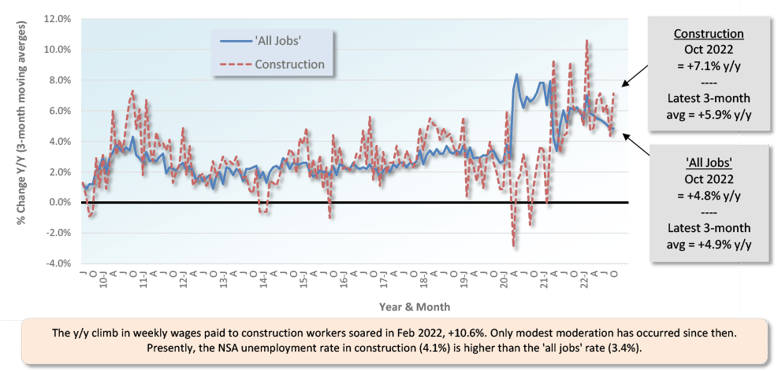
Table 3: 2022 YTD Ranking of Top 20 States by $ Volume of Nonresidential Construction Starts — ConstructConnect®
.png?width=778&height=604&name=Nov%2022%20Snapshot%20Table%203(new).png)
Table 4: 2022 YTD Ranking of Top 20 States by $ Volume of Nonresidential Building Construction Starts — ConstructConnect®
.png?width=778&height=601&name=Nov%2022%20Snapshot%20Table%204(new).png)
Table 5: 2022 YTD Ranking of Top 20 States by $ Volume of Heavy Engineering/Civil Construction Starts — ConstructConnect®
.png?width=778&height=584&name=Nov%2022%20Snapshot%20Table%205(new).png)
October 2022’s y/y results for three building related BLS Producer Price Index series were: (A) construction materials special index, +2.9% (decelerating from September’s +5.9%); (B) inputs to new construction index, excluding capital investment, labor, and imports, +10.1% (retreating from +11.2% in the previous month); and (C) final demand construction, designed to capture bid prices, +19.6% (easing from the +23.2% change in the period prior).
(A) comes from a data series with a long history, but it’s confined to a limited number of major construction materials. (B) has a shorter history, but it’s more comprehensive in its coverage, although it includes some items (e.g., transportation) that aren’t strictly materials.
Concerning the y/y cost of some major construction material inputs, as revealed in the PPI data set for October 2022 from the BLS, the y/y increases have lost some of their power to frighten. Diesel fuel is still cringeworthy at +61.5%, but asphalt has slowed to +20.4% (it was +80% in May). Gypsum is now +16.2%; cement, +13.4%; ready-mix concrete, +11.8%; hot rolled steel bars, plates, and structural shapes, +9.8%; softwood lumber, +4.4%; aluminum mill shapes, -9.3%; and copper wire and cable, -11.1%. There’s an inputs to highways and streets PPI index and it’s +11.8% y/y.
The value of construction starts each month is derived from ConstructConnect’s database of all active construction projects in the United States. Missing project values are estimated with the help of RSMeans’ building cost models. ConstructConnect’s nonresidential construction starts series, because it is comprised of total-value estimates for individual projects, some of which are super-large, has a history of being more volatile than many other leading indicators for the economy.
ConstructConnect’s total residential starts in October 2022 were +12.3% m/m, -0.9% y/y, and +0.4% YTD. Multi-family starts were +32.5% m/m, +45.5% y/y and +22.6% YTD. Single-family starts were +0.6% m/m, but -20.2% y/y and -8.3% YTD.
Including home building with all nonresidential categories, Grand Total starts in October 2022 were -1.3% m/m, but +21.8% y/y and +16.9% YTD.
ConstructConnect adopts a research-assigned start date. In concept, a start is equivalent to ground being broken for a project to proceed. If work is abandoned or rebid, the start date is revised to reflect the new information.
My recent posts have largely centered on the concerns facing the industry, with multiple warnings about which segments are most likely to be negatively impacted by current financial market conditions. For November, I will break with this trend and focus on those segments which are expected to do well over the coming 12 months.
The climbing cost of mortgage payments due to rising loan rates has strongly sapped demand for single-family construction in the second half of 2022, as evidenced by the recent and dramatic decline in permits. Meanwhile, multi-family construction, a more affordable alternative to single-family homes, continues to report steady permitting levels. Construction leaders studying the residential space in 2023 will do well to monitor the multi-family market separately from the single-family market and think critically when interpreting total residential statistics.
In the nonresidential capital spending arena, ConstructConnect’s Expansion Index offers powerful, forward-looking construction activity information by verticals for both the United States and Canada. From this data set, it is possible to glean insights about how the construction industry is transforming in light of macroeconomic changes.
In both countries, recent total planned construction spending data is signaling slowing prospects in the civil and commercial verticals. Conversely, those verticals with the greatest increases in planned project spending at the end of October included the industrial, community, and government verticals. Please see the next section for additional information on the Expansion Index and how it can be freely accessed by clicking on the link provided. - Michael Guckes, Senior Economist
A rule of thumb is that nonresidential construction is a lagging indicator among economic measures. Companies are hesitant to undertake capital spending until their personnel needs are rapidly expanding and their office square footage or plant footprints are straining capacity. Plus, it helps if profits are abundant. Also, today’s greater tendency to work from home has made office occupancy and the resulting need for construction much more difficult to assess. The rule, however, may not hold true under the present circumstances, with the weakness in such areas as retail spending to be offset by a rich deposit of large industrial and engineering construction projects to mine.
Each month, ConstructConnect publishes information on upcoming construction projects at its Expansion Index.
The Expansion Index, for hundreds of cities in the United States and Canada, calculates the ratio, based on dollar volume, of projects in the planning stage, at present, divided by the comparable figure a year ago. The ratio moves above 1.0 when there is currently a larger dollar volume of construction prospects than there was last year at the same time. The ratio sinks below 1.0 when the opposite is the case. The results are set out in interactive maps for both countries.
Click here to download the Construction Industry Snapshot Package - October 2022 PDF.
Click here for the Top 10 Project Starts in the U.S. - October 2022.
Click here for the Nonresidential Construction Starts Trend Graphs - October 2022.
Table 1: Value of United States Nonresidential Construction Starts October 2022 - ConstrucConnect
*Includes transportation terminals and sports arenas.
Source: ConstructConnect Research Group and ConstructConnect.
Table: ConstructConnect.
Table 6: Value of United States Construction Starts
ConstructConnect Insight Version – October 2022
Arranged to match the alphabetical category drop-down menus in Insight
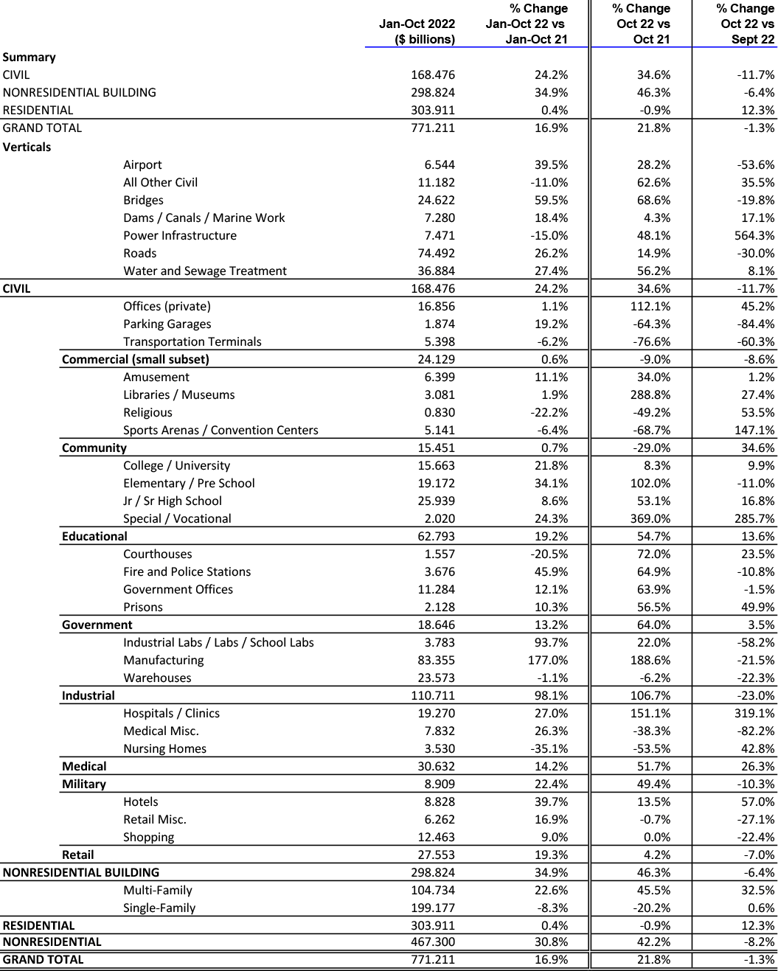
Table 2 conforms to the type-of-structure ordering adopted by many firms and organizations in the industry. Specifically, it breaks nonresidential building into ICI work (i.e., industrial, commercial, and institutional), since each has its own set of economic and demographic drivers. Table 3 presents an alternative, perhaps more user-friendly and intuitive type-of-structure ordering that matches how the data appears in ConstructConnect Insight.
Source: ConstructConnect.
Table: ConstructConnect.
Table 8: U.S. YTD Regional Starts
Nonresidential Construction* — ConstructConnect
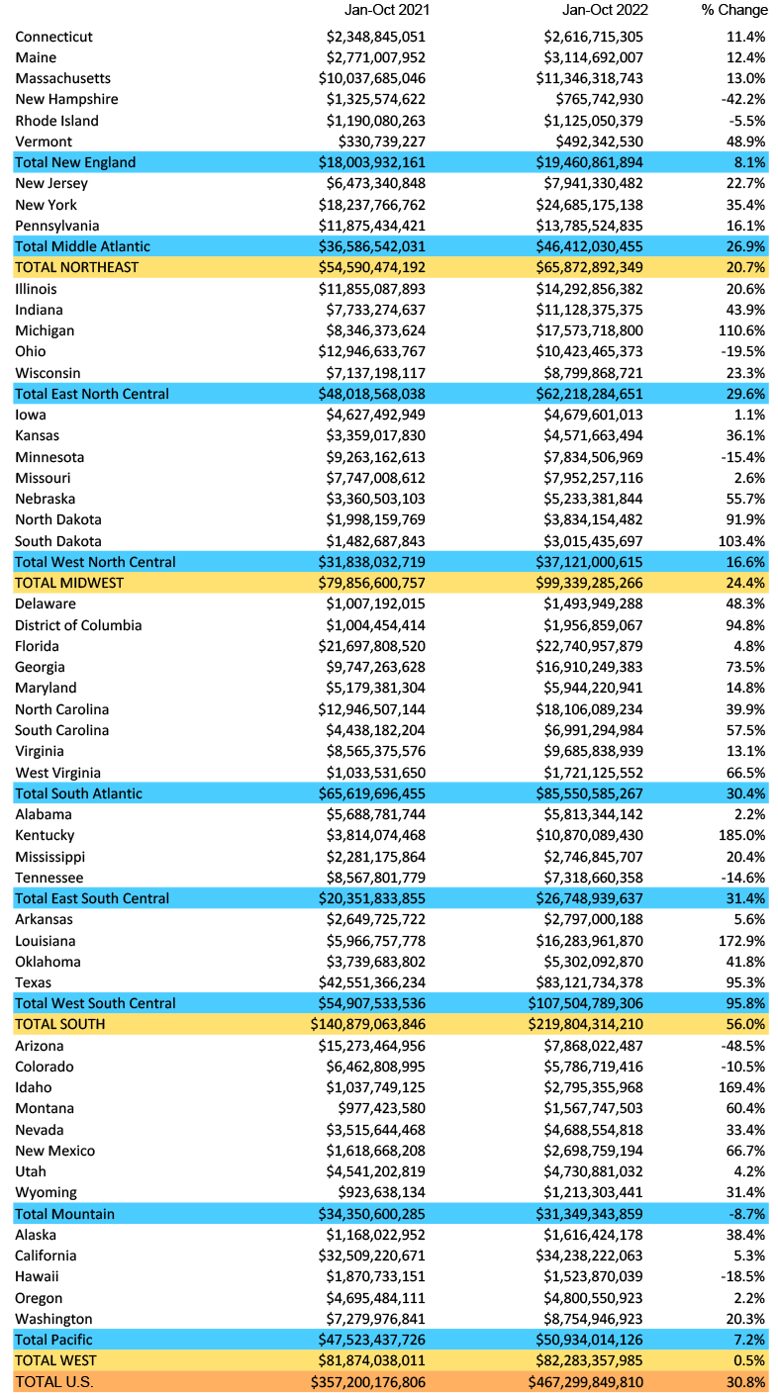
Data Source and Table: ConstructConnect.
Table 9: Value of United States National Construction Starts – October 2022 – ConstructConnect
Billions of current $s, not seasonally adjusted (NSA)
*Figures above are comprised of nonres building and engineering (i.e., residential is omitted).
Data Source and Table: ConstructConnect
ConstructConnect's Expansion Index shows a 22% increase in the total dollar value of U.S. planned construction projects in October 2022 from a year...
The construction industry added only +1,000 jobs in October 2022. 2022’s year-to-date monthly average gain in construction employment has been...
ConstructConnect reports the top ten nonresidential construction starts monthly in the Construction Economy Snapshot from Michael Guckes Chief...
A report on US regional nonresidential construction starts with commentary and analysis from Michael Guckes, Chief Economist at ConstructConnect