/industry-snapshot_dec_2022.jpg)
/industry-snapshot_dec_2022.jpg)
Nonresidential Construction Starts Trend Graphs - November 2022
Below are six graphs recording 12-month moving averages of ConstructConnect’s nonresidential construction starts.

ConstructConnect announced today that November 2022’s volume of construction starts, excluding residential work, was $31.1 billion, a decline of -36.3% compared with October’s figure of $48.9 billion (originally reported as $47.5 billion; the difference coming mainly in the multi-unit residential subcategory of starts).
Two factors contributing to the month-to-month drop-off were seasonality (i.e., fewer starts in colder weather) and a reduced contribution made by megaprojects (i.e., projects of a billion dollars or more each). There were two megaproject starts in the latest month, but they were both at the low-end dollar threshold and, at $2.1 billion combined, were not a match for the $9.4 billion wrapped up in three such groundbreakings in October.
View this information as an infographic
Click here to download the complete Construction Industry Snapshot Package - November 2022 PDF.
November’s two megaprojects were a carbon capture and storage facility in Texas and a solar power plant in Las Vegas, Nevada. The former as a category of structure is often referred to as a CCUS facility, standing for CO2 capture, utilization, and sequestration. The Texas project also carries the acronym DAC for direct air capture. To be located in the Permian shale rock and fossil fuel basin, large fans will draw in air and, by means of chemical processes, extract CO2, which will either be pumped underground for insertion in spongy rock formations or be used as a base ingredient in some manufactured products.
The year-to-date total dollar volume for megaproject starts is now $85.9 billion (from 27 projects), already beating the previous high of $79.1 billion (from 35 projects), which was set during the full year, 2019.
November 2022’s total dollar volume of nonresidential construction starts was -8.6% when compared with November 2021’s figure. Singing a far sweeter note, though, total nonresidential starts on a year-to-date basis, have been +28.7% versus January to November of last year.
To complete the starts picture, the grand total dollar volume (i.e., adding residential to nonresidential activity) in November 2022 was -31.1% m/m and -18.2% y/y, but +15.0% YTD.
There are three major subcategories of total starts: residential, nonresidential building, and heavy engineering/civil. On a year-to-date percentage-change basis in November, nonresidential building starts were in first place, up by about a third, +32.3%. In second place, not too far back, were heavy engineering/civil starts, +22.9%. In last position, and performing poorly, were residential starts, -1.1%.
On a month-to-month basis in November, none of the three categories had anything to brag about. Nonresidential buildings recorded the steepest decline, -45.1%, followed by residential, at -22.6%, and engineering, -17.7%. It wasn’t just seasonality and a lack of mega projects that were the downfall of November’s starts. There was a pretty general pulling back of new construction project initiations. Fears of recession tied to the Fed’s interest rate increases are causing some owners to hesitate when pressed on the question of pushing the button on go-aheads.
Other statistics often beloved by analysts are trailing 12-month results, and these are set out for all the various type-of-structure categories in Table 10.
Grand total TTM starts in November, at -1.3% on a month-to-month basis, highlighted some developing weakness, after they were +1.7% in October ad +0.9% in September.
On a year-over-year basis in November, grand total TTM starts, at +14.8%, were slower off the mark than in either October, +17.3%, or September, +15.6%.
Starts compile the total estimated dollar value and square footage of all projects on which ground is broken in any given month. They lead, by nine months to as much as two years, put-in-place statistics which are analogous to work-in-progress payments as the building of structures proceeds to completion.
PIP numbers cover the universe of construction, new plus all manner of renovation activity, with residential traditionally making up two-fifths (about 40%) of the total and nonresidential, three-fifths (i.e., the bigger portion, at around 60%).
During the past several years, however, there has been a dramatic change in the first- to second-place ordering. In 2021’s full-year PIP results, the residential to nonresidential relationship was about half and half. Through October of the present year, 2022, it’s been residential claiming the larger share of the total, 51.8%, with nonresidential left holding the smaller 48.2%.
The January-October 2022 over January-October 2021 total dollar volume of PIP construction was +10.8%. Residential, at +16.4% YTD, remained far ahead of nonresidential, +5.3% YTD. But the latter included one type-of-structure subcategory that was laying out an impressive path forward, manufacturing at +30.0% YTD.
PIP numbers, being more spread out, have smaller peak-over-trough percent-change amplitudes than the starts series. As an additional valuable service for clients and powered by its extensive starts database, ConstructConnect, in partnership with Oxford Economics, a world leader in econometric modeling, has developed put-in-place construction statistics by types of structure for U.S. states, cities, and counties, actuals, and forecasts. ConstructConnect’s PIP numbers are released quarterly and are featured in a separate report.
Construction’s share of U.S. total nonfarm employment in the monthly labor market report issued by the Bureau of Labor Statistics is slightly more than 5.0%. To claim its proportional share of November’s economy-wide number-of-jobs increase of +263,000, the figure for construction would have needed to be +13,000. Instead, it was a better +20,000.
The monthly average increase in construction employment through the first 11 months of this year has been +19,000, nicely outpacing last year’s comparable figure of +13,000.
Construction’s not seasonally adjusted unemployment rate in November was 3.9%, down from October’s 4.1% and notably tighter than November of last year’s 4.7%.
The latest NSA U rate for construction of 3.9% is a little above the nation’s ‘all jobs’ figure of 3.4%. It’s also a rung or two higher than manufacturing’s barely-there 2.7%. Both the manufacturing and construction sectors are in the goods-producing segment of the economy (i.e., as opposed to services-producing), and there is considerable overlap between their labor pools.
In the latest month, the U.S. construction sector achieved the same year-over-year advance in number of employees as all jobs, +3.3%. The staffing increase by manufacturers was a whisker faster, +3.4%. Private sector services employment was +3.7% y/y. Among all services subsectors, leisure and hospitality achieved the greatest y/y pickup in jobs count, +7.3%.
In other segments of the economy with close ties to construction, the latest y/y percentage changes in employment have been as follows: oil and gas exploration and development, +12.1%; architectural and engineering design services, +5.5%; cement and concrete product manufacturing, +3.3%; machinery and equipment rental and leasing, +3.0%; real estate, +2.8%; and building materials and supplies dealers, 0.0%.
Design services work at architectural and engineering firms leads into later on-site activity. Therefore, the +5.5% jobs jump for the industry is a positive sign concerning future in-the-field employment. The press release accompanying the latest Architecture Billings Index from the American Institute of Architects notes that the sector is continuing to be supported by “near record levels of backlogs.” But as for the ABI’s reading in November, it took another turn in the wrong direction, landing at 46.6, after descending to 47.7 in October. For the ABI, above or below 50.0 is the demarcation point that separates more from fewer sales month to month.
Graph 1: Change in Level of U.S. Construction Employment, Month to Month (M/M) −
Total & by Categories - November 2022
.png?width=800&height=723&name=U.S.%20Construction%206%20Graphs%20(Nov%2022).png)
Graph 2: U.S. Manufacturing Versus Construction Employment - November 2022 - Seasonally Adjusted (SA) Payroll Data
.png?width=800&height=656&name=U.S.%20Construction%20vs%20Mnfg%20(Nov%2022).png)
Graph 3: U.S. Unemployment Rates: All Jobs & Construction - November 2022 (Not Seasonally Adjusted)
.png?width=800&height=648&name=U.S.%20U%20Rates%20All%20Jobs%20vs%20Const%20(Nov%2022).png)
Graph 4: U.S. Employment - November 2022 - % Change Y/Y (Seasonally Adjusted)
.png?width=800&height=543&name=U.S.%203%20in%201%20Graph%20(Nov%2022).png)
Graph 5: U.S. Total & Subsectors Y/Y Jobs Change - November 2022 (Seasonally Adjusted)
.png?width=800&height=663&name=U.S.%20by%20Sector%20(Nov%2022).png)
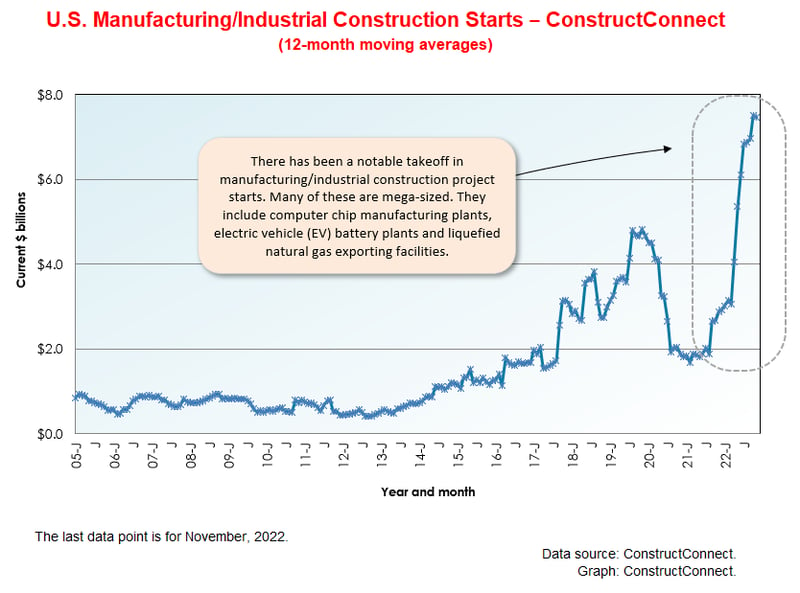
Graph 6: U.S. Manufacturing Construction Starts - ConstructConnect (12-Month Moving Averages)
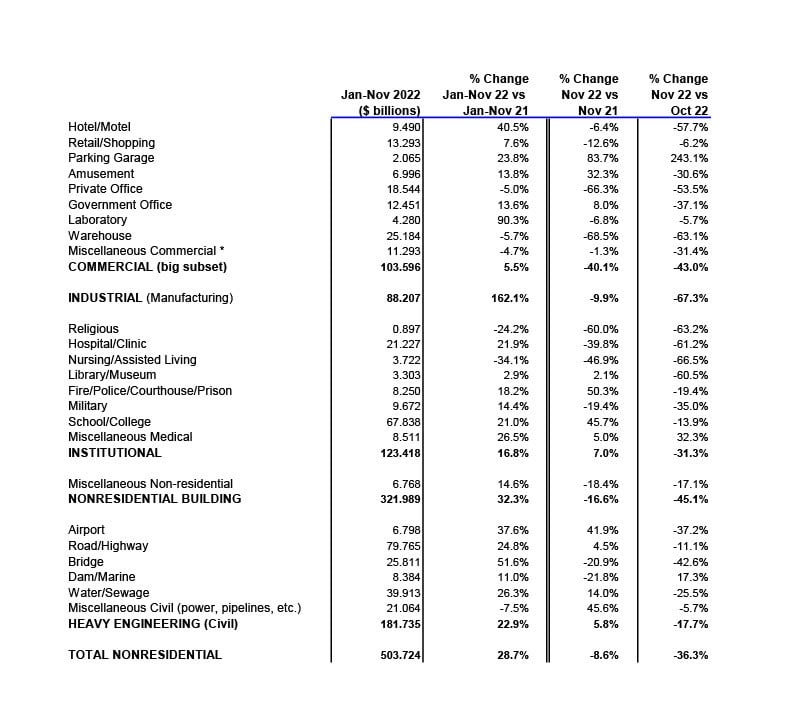
The -36.3% month-to-month drop in November’s total nonresidential starts resulted from declines in all the major type-of-structure subcategories, with industrial retreating the most (-67.3%), followed by commercial (-43.0%), institutional (-31.3%), then engineering (-17.7%).
The -8.6% step back in total nonresidential starts in November of this year versus November of last year (y/y) was due mainly to a big chunk taken out of commercial (-40.1%), with industrial down as well (-9.9%). Institutional (+7.0%) and engineering (+5.8%) were quite alright.
November’s +28.7% year-to-date advance in total nonresidential starts was thanks to an astonishing jump in industrial (+162.1%), a good leap forward by engineering (+22.9%), a decent gain by institutional (+16.8%), and a modest uptick by commercial (+5.5%).
There are two dominant subcategories of total nonresidential starts. When the volumes of roads/highways and schools/colleges are added together, they accounted for 29.3% of November’s total nonresidential starts YTD (i.e., shares of 15.8% and 13.5%, respectively).
The three percentage-change metrics for street starts in November 2022 were -11.1% m/m, but +4.5% y/y, and +24.8% YTD. For educational facility starts, the results were -13.9% m/m, but +45.7% y/y and +21.0% YTD. At the various levels of education, the preschool and elementary grouping has done best year to date, +38.0%, although the colleges and universities designation can’t complain either, +17.4%.
Important beyond roads within the engineering subcategory are water/sewage and bridge starts. The results for the former in November were -25.5% m/m, but +14.0% y/y and +26.3% YTD. For the latter, there were downturns of -42.6% m/m and -20.9% y/y, but the YTD change was cheery nonetheless, +51.6%.
Important beyond schools in institutional are three medical subcategories – i.e., hospitals/clinics, nursing/assisted living, and miscellaneous medical. Their combined starts in November 2022 were -52.3% m/m and -32.3% y/y, but +12.3% YTD. On their own, hospital/clinic starts in the latest month were -61.2% m/m and -39.8% y/y, but +21.9% YTD.
Also performing well within institutional to date this year have been the police station/fire hall (+38.7% YTD) and prisons (+24.5% YTD) subcategories of starts.
Among commercial starts in November, the hotel/motel designation was weak m/m (-57.7%), but surprisingly upbeat YTD (+40.5%). Other subcategories with notable gains YTD were laboratories (+90.3%), amusement (+13.8%), government offices (+13.6%), and retail/shopping (+7.6%). On a YTD basis, private offices and warehouses were off to about the same degree, -5.0% and -5.7%, respectively.
Finally, there’s the most dramatic number of all to place in the spotlight, the +162.1% YTD improvement in industrial/manufacturing. 2022, with only one month still to go, has been overflowing with initiations of giant-sized projects in EV battery production, semiconductor chipmaking, and natural gas compression (i.e., as LNG) and export.
Table 2: Construction Starts in Some Additional Type of Structure Subcategories
.png?width=800&height=543&name=Small%20Table%20(Nov%2022).png)
This Industry Snapshot sets out the history, from January 2005 to the present, of 12-month moving ConstructConnect starts averages for a dozen construction types of structures. The moving-average approach is designed to capture trends. (As a technical note, the moving average is graphed in the ending month.)
During 2022, the curve for nonresidential buildings has been showing more uplift than the one for engineering. Institutional has been climbing better than commercial. The private office building curve hasn’t managed a turnaround improvement yet, but long-suffering retail is indicating a leveling out.
Schools/colleges have taken on a nice upwards slope. Hospitals/clinics have not yet broken away from a sideways path. Roads/highways, water/sewage, and bridges have all been trending upwards of late. Miscellaneous civil is awaiting another surge from a still-to-be-identified ultra-large project.
For ease of viewing, Graphs 7 and 8 show smoothed curves (i.e., based on three-month moving averages) for the Job Openings and Labor Turnover Survey results pertaining to construction industry openings and hires.
As Graph 7 makes clear, vacant positions (i.e., job openings) in the construction sector continue to be high. But there hasn’t been much success in rectifying the situation through hires (Graph 8). There are a couple of factors at play. The nation’s unemployment rate is hovering near a record low, and there’s an extreme shortage of willing and available workers. Additionally, worries about recession and how deep it may become and how long it may last are undoubtedly causing employers, in the present moment, to be wary about taking on staff too aggressively.
Graph 7: U.S. Construction Job Openings (from JOLTS Report)
(3-month Moving Averages placed in Latest Month)
.png?width=800&height=586&name=JOLTS%20Openings%20(Oct%2022).png)
Graph 8: U.S. Construction Job Hires (from JOLTS Report)
(3-month Moving Averages placed in Latest Month)
.png?width=800&height=559&name=JOLTS%20Hires%20(Oct%2022).png)
Tables B-3 and B-8 of the monthly Employment Situation report, from the BLS, record average hourly and average weekly wages for industry sectors. B-3 is for all employees (i.e., including bosses) on nonfarm payrolls. B-8 is for production and nonsupervisory personnel only (i.e., it excludes bosses). For all jobs and construction, there are eight relevant percentage changes to spotlight.
From November 2022’s Table B-3 (including bosses), y/y all-jobs earnings were +5.1% hourly and +3.9% weekly. Construction workers, as a subset of all jobs, did better on both fronts, +5.8% hourly, and +4.1% weekly. From Table B-8 for production and nonsupervisory workers (i.e., excluding bosses), the y/y all-jobs paycheck advances were +5.8% hourly and +4.9% weekly. Construction workers jogged ahead a bit hourly, +6.1%, but fell back a bit weekly, +4.5%.
Graph 9: Average Hourly Earnings Y/Y - All Jobs & Construction
.png?width=800&height=550&name=U.S.%20Earnings%20Hrly%20(Nov%2022).png)
Graph 10: Average Weekly Earnings Y/Y - All Jobs & Construction
.png?width=800&height=527&name=U.S.%20Earnings%20Wkly%20(Nov%2022).png)
Table 3: 2022 YTD Ranking of Top 20 States by $ Volume of Nonresidential Construction Starts — ConstructConnect®
.png?width=800&height=726&name=U.S.%20IS%20Set%20of%203%20NR%20(Nov%2022).png)
Table 4: 2022 YTD Ranking of Top 20 States by $ Volume of Nonresidential Building Construction Starts — ConstructConnect®
.png?width=800&height=719&name=U.S.%20IS%20Set%20of%203%20NRB%20(Nov%2022).png)
Table 5: 2022 YTD Ranking of Top 20 States by $ Volume of Heavy Engineering/Civil Construction Starts — ConstructConnect®
.png?width=800&height=734&name=U.S.%20IS%20Set%20of%203%20Eng%20(Nov%2022).png)
November 2022’s y/y results for three building related BLS Producer Price Index (PPI) series were: (A) construction materials special index, +0.6% (easing back from October’s +3.5%); (B) inputs to new construction index, excluding capital investment, labor, and imports, +9.8% (a small moderation from the previous month’s +10.5%); and (C) final demand construction, designed to capture bid prices, +19.0% (not much different from +19.2% in the period prior).
(A) comes from a data series with a long history, but it’s confined to a limited number of major construction materials. (B) has a shorter history, but it’s more comprehensive in its coverage, although it includes some items (e.g., transportation) that aren’t strictly materials.
Concerning the cost of some major construction material inputs, as revealed in the PPI data set for November 2022 from the BLS, some of the y/y increases have lost their sting. That’s not the case for No. 2 diesel fuel, however, +59.6%. Other noteworthy changes have been: gypsum, +16.6%; cement, +12.9%; ready-mix concrete, +12.3%; hot rolled steel bars, plates, and structural shapes, +7.1%; asphalt, +3.9%; softwood lumber, -3.9%; copper wire and cable, -12.1%; and aluminum mill shapes, -12.7%. There’s an inputs to highways and streets PPI index, and it’s +10.7% y/y.
The value of construction starts each month is derived from ConstructConnect’s database of all active construction projects in the United States. Missing project values are estimated with the help of RSMeans’ building cost models. ConstructConnect’s nonresidential construction starts series, because it is comprised of total-value estimates for individual projects, some of which are super-large, has a history of being more volatile than many other leading indicators for the economy.
ConstructConnect’s total residential starts in November 2022 were -22.6% m/m, -28.4% y/y, and -1.1% YTD. Multi-family starts were -54.5% m/m and -44.7% y/y, but +19.2% YTD. Single-family starts were +4.1% m/m, -19.7% y/y, and -9.4% YTD.
Including home building with all nonresidential categories, Grand total starts in November 2022 were -31.1% m/m and -18.2% y/y, but +15.0% YTD.
ConstructConnect adopts a research-assigned start date. In concept, a start is equivalent to ground being broken for a project to proceed. If work is abandoned or rebid, the start date is revised to reflect the new information.
Economic data released as of mid-December, representing November’s activity, pointed to an economy that is normalizing after years of disruptions. The latest broad-based U.S. inflation reading at an annualized +7.1% marked the fifth consecutive month of slowing price increases, down from June’s +9.1%. Slowing inflation is presently resulting from both weakening demand and increasing supply.
Demand as measured by ConstructConnect’s Expansion Index has been pointing to generally accelerating starts data in the United States, however, in Canada, the last 12 months of expansion readings have generally trended lower after reaching a high of 1.22 in late 2021. The latest Canadian figure of 1.06, once inflation is factored in, could even signal a contraction in real Canadian construction spending.
The divergence in national activity trends may be a matter of U.S. starts data, which is measured in dollars, being heavily influenced by billion-dollar or more megaprojects. In the United States, megaprojects presently constitute a historically high percentage of all construction starts dollars despite their relatively small count.
The Architectural Billings Index, produced by the American Institute of Architects, upholds this view. For much of 2022, architecture firm activity via the ABI has signaled slowing expansion. Break-even is represented by a level of 50. Unfortunately, October’s and November’s billings, and design contracts activity readings both fell below 50. This is ominous for the construction industry because architecture activity is generally considered to be a leading indicator of future onsite construction work.
The other determinant of prices: production and supplies, appears to have generally recovered from COVID-19’s disruptions. The inventory-to-sales ratio of construction materials has returned to the upper bounds of historic levels. The implication is that material availability, measured broadly, is generally no longer a constraint to the operations of construction firms.
Transportation activity measures similarly point to reduced stress on logistics networks after two years of bottlenecks. The Port of Los Angeles and Long Beach, in late November, had no ships waiting for berths for the first time since COVID-19 initially reared up. Measures of trucking and rail congestion similarly have been trending lower for much of the year.
This combination of tepid demand and a well-stocked supply chain should predispose industry leaders toward creating strategic inventory plans that increase turnover and preserve free cash. - Michael Guckes, Senior Economist
A rule of thumb is that nonresidential construction is a lagging indicator among economic measures. Companies are hesitant to undertake capital spending until their personnel needs are rapidly expanding and their office square footage or plant footprints are straining capacity. Plus, it helps if profits are abundant. Also, today’s greater tendency to work from home has made office occupancy and the resulting need for construction much more difficult to assess. The rule, however, may not hold true under the present circumstances, with the weakness in such areas as retail spending to be offset by a rich deposit of large industrial and engineering construction projects to mine.
Each month, ConstructConnect publishes information on upcoming construction projects at its Expansion Index.
The Expansion Index, for hundreds of cities in the United States and Canada, calculates the ratio, based on dollar volume, of projects in the planning stage, at present, divided by the comparable figure a year ago. The ratio moves above 1.0 when there is currently a larger dollar volume of construction prospects than there was last year at the same time. The ratio sinks below 1.0 when the opposite is the case. The results are set out in interactive maps for both countries.
Click here to download the Construction Industry Snapshot Package - November 2022 PDF.
Click here for the Top 10 Project Starts in the U.S. - November 2022.
Click here for the Nonresidential Construction Starts Trend Graphs - November 2022.
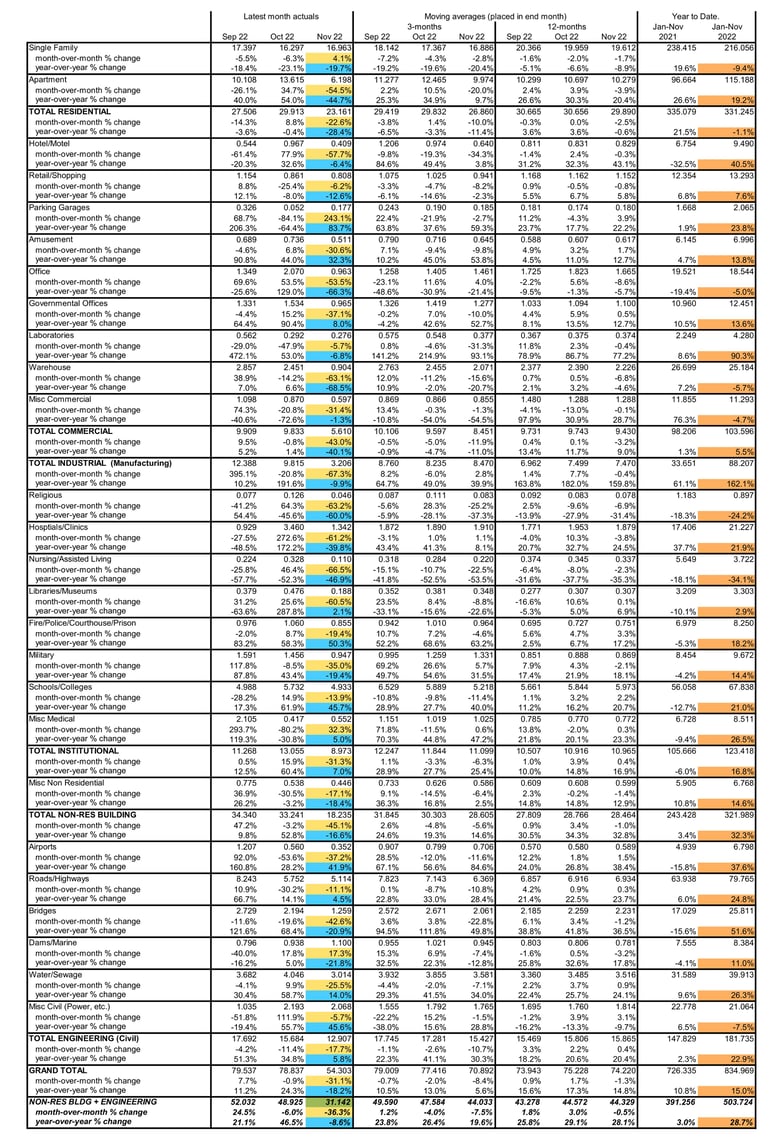
Table 1: Value of United States Nonresidential Construction Starts October 2022 - ConstrucConnect
*Includes transportation terminals and sports arenas.
Source: ConstructConnect Research Group and ConstructConnect.
Table: ConstructConnect.
Table 6: Value of United States Construction Starts
ConstructConnect Insight Version – November 2022
Arranged to match the alphabetical category drop-down menus in Insight
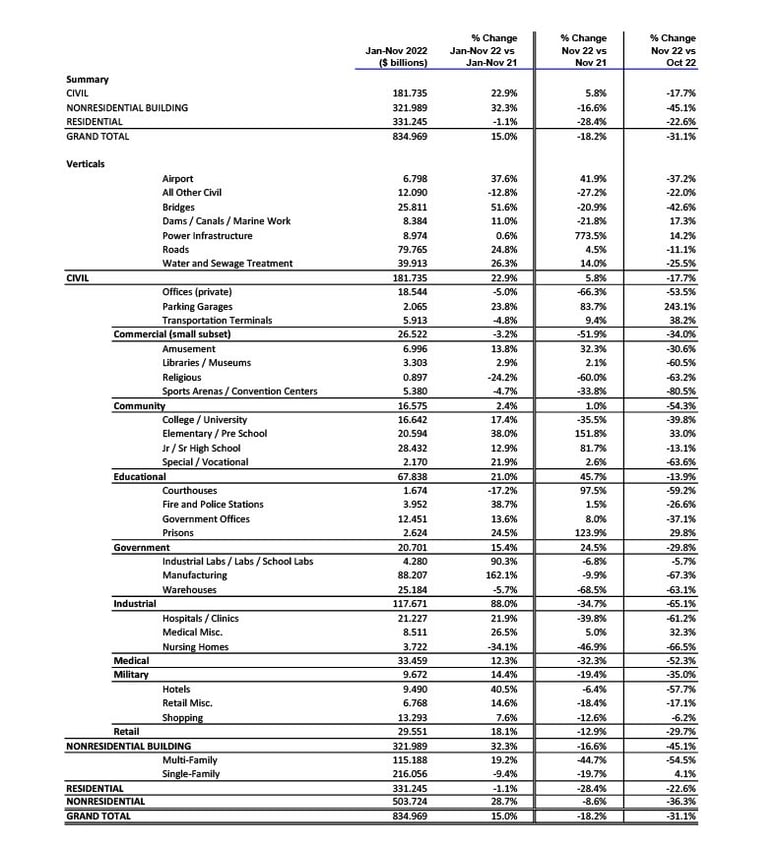
Table 2 conforms to the type-of-structure ordering adopted by many firms and organizations in the industry. Specifically, it breaks nonresidential building into ICI work (i.e., industrial, commercial, and institutional), since each has its own set of economic and demographic drivers. Table 3 presents an alternative, perhaps more user-friendly and intuitive type-of-structure ordering that matches how the data appears in ConstructConnect Insight.
Source: ConstructConnect.
Table: ConstructConnect.
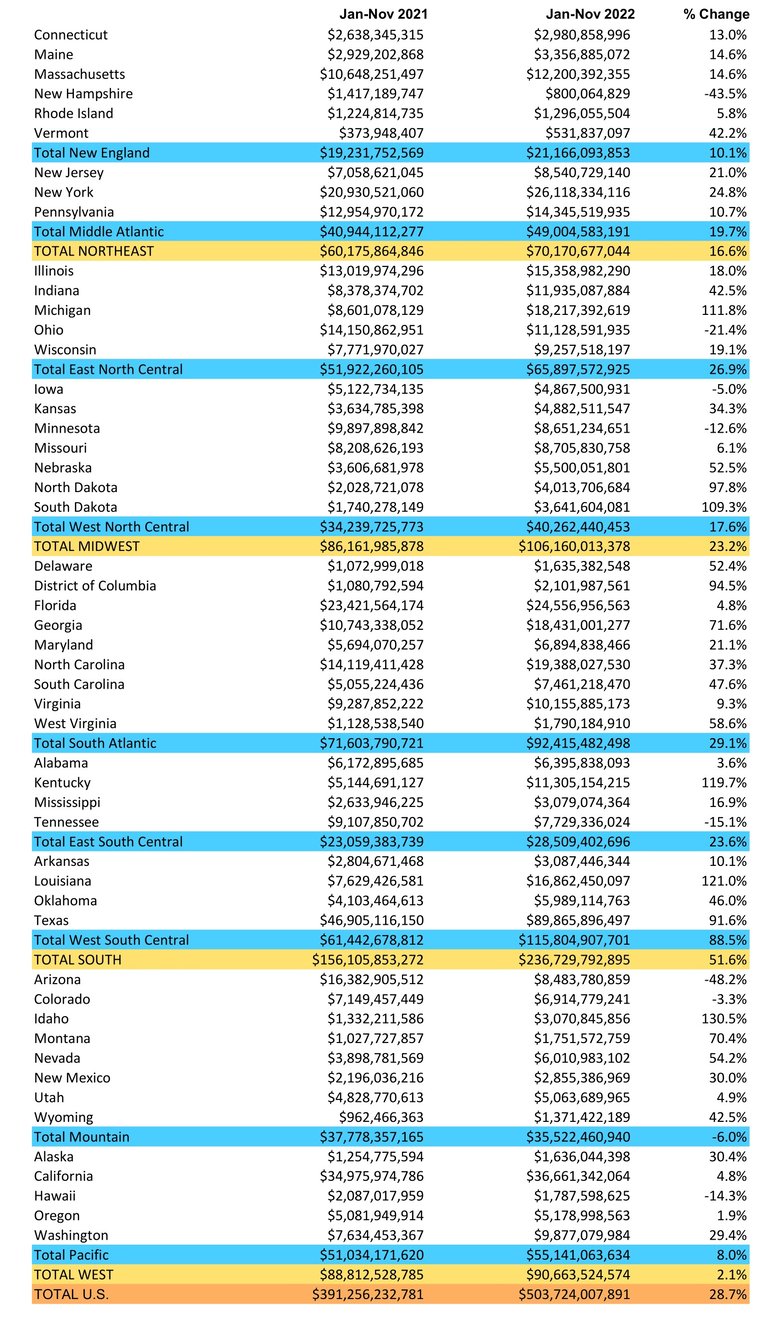
Table 8: U.S. YTD Regional Starts
Nonresidential Construction* — ConstructConnect
Data Source and Table: ConstructConnect.
Table 9: Value of United States National Construction Starts – November 2022 – ConstructConnect
Billions of current $s, not seasonally adjusted (NSA)
*Figures above are comprised of nonres building and engineering (i.e., residential is omitted).
Data Source and Table: ConstructConnect
Below are six graphs recording 12-month moving averages of ConstructConnect’s nonresidential construction starts.
The construction industry added 20,000 jobs in November, with a not seasonally adjusted unemployment rate of 3.9%.
ConstructConnect Chief Economist Michael Guckes provides a monthly update on construction employment, wages, and hiring.
ConstructConnect Chief Economist Michael Guckes provides insights and analysis monthly on US Nonresidential and Residential Construction Starts