In short:
- Construction market analytics involves collecting projects, starts, and specification data, and analyzing them to forecast demand and measure market position.
- Forecasting: Use construction starts data to size future demand by project category and region.
- Trend analysis: Compare your project category's activity across regions and time periods, then drill into the projects behind the numbers.
- Market position: Track specification share by product, state, and competitor.
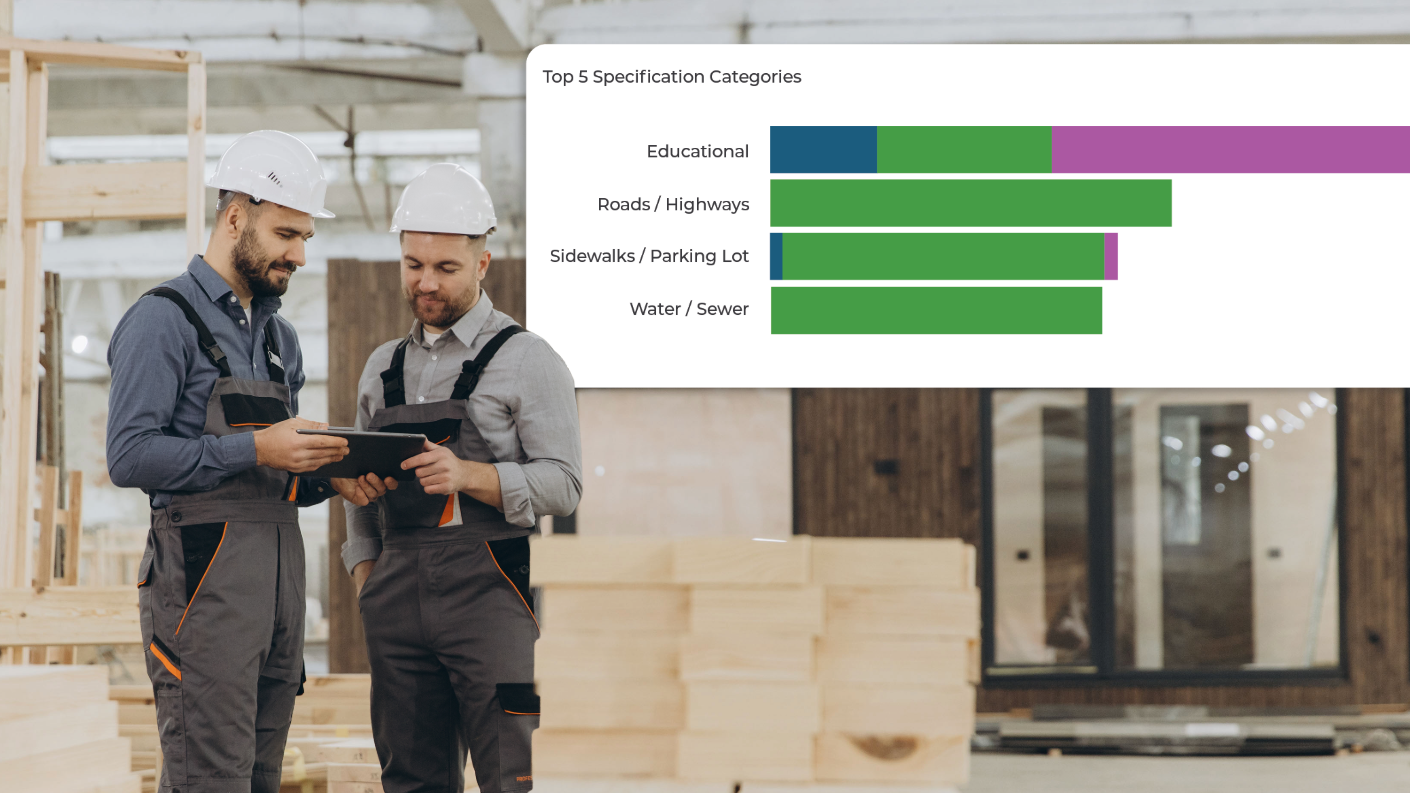
- ConstructConnect® Analytics puts project activity, project stage, and specification share in one view, so you can track market position without building the reports by hand.
What is Construction Market Analytics?
Construction market analytics is the collection of projects, starts, and specification data that's used to measure market position and forecast demand. For a building product manufacturer (BPM), it answers three questions: where is demand heading, where are we getting specified, and who is gaining ground on us. It replaces spreadsheets and gut feel with a repeatable view of the market that sales, marketing, and leadership can all work from.
How to Use Construction Starts Data for Forecasting
Your product ships when a project breaks ground, not when it's announced. Construction starts data tells you how much work is about to move from planning into the field, which makes it the most direct input to a demand forecast.
Start with three steps:
- Pull starts for your project categories. Total starts hide the story. ConstructConnect's Autumn 2026 Construction Starts Forecast, built with Oxford Economics, projects nonresidential building up 8.7% in 2026 and manufacturing construction down nearly 43%. A BPM selling into plants and one selling into data centers are in very different markets.
- Break it out by region. National numbers rarely match what your territories see. Not sure where to start? Check out our free-to-access Construction Starts Forecast Reports, which are published quarterly and include state-specific data.
- Watch projects before they start. Starts are a lagging view of the same pipeline. Projects in design and bidding show where starts are headed, and filtering a project database by stage and start date shows how much work is queued up in your categories and states. Once work is underway, spending data confirms the trend, though it trails starts, so use it to verify a trend rather than spot one early.
That's the do-it-yourself route, and it means pulling starts, forecasts, and project stages from separate places and lining them up by hand. ConstructConnect® Analytics, included in ConstructConnect® Project Intelligence Premium, puts project counts and values, project stage, and start dates in one filtered view, so you can see how much work is queued up in your categories and states without the spreadsheet.
How to Analyze Construction Market Trends for Your Project Category
A trend only matters if it's specific to what you sell. Analyze it in layers:
- Category: Is your project type growing faster or slower than commercial construction overall?
- Geography: Which states and regions are driving the change?
- Time: Compare the same period year over year to strip out seasonality.
- Project stage: Design and bidding activity shows up before starts do.
How to Tell If Your Market Share is Growing or Declining in a Region
Hard sales numbers tell you about the past, and they lag. Specification share tells you where you're headed. It shows how often your products are named in project documents, before anyone buys anything.
To read it by region with ConstructConnect Analytics:
- Set up search filters for your products and your competitors' products. Keep the filters consistent so periods are comparable.
- Compare share by state, then check the change versus the prior period.
- Look at the projects behind any shift. Rising share on a few large projects is a different story than rising share across many small ones.
What Metrics Should a BPM Track for Market Position?
A short list beats a dashboard of 40 tiles. These five cover most of what a BPM leadership team needs:
| Metric |
What it tells you |
| Starts volume by category |
Size of the market ahead of you |
| Specification share by tag |
Whether you're gaining or losing specs against competitors |
| Spec share by state |
Which territories need attention |
| Project count, value, and average value |
How the market is shifting by category and region |
| Conversion on specified projects |
How many specs turn into sales |
How ConstructConnect Analytics Puts This in One Place
Doing this by hand means stitching together government releases, industry indices, and your own CRM exports. ConstructConnect® Analytics, included in ConstructConnect® Project Intelligence Premium, puts the pieces in a single view across three dashboards (with a fourth coming soon):
- Market Overview shows where the market is shifting, with project count, value, and average value by category and location.
- Specification Positioning shows how often your products are specified compared with competitors, by state, product, and project type.
- Company Targeting shows which companies to call next.
- A Forecast dashboard is coming soon, adding forward-looking projections across more than 50 project categories to the same view.
The dashboards sit on more than 825,000 verified projects and 2 million searchable plans and specifications, with 15,000 new U.S. and Canadian projects added every month. AI-generated summaries flag what changed when you adjust a filter, and Saved Dashboards let you return to the same view without rebuilding it. For the prospecting side, see our blog on how BPM sales teams research prospects faster. For planning, our guide to the specification data that should drive your 2027 plan walks through using spec share as a leading indicator.
Turn Your Market Data Into a Territory Plan
Forecasting works when everyone is looking at the same numbers. Analytics gives your sales leaders, marketers, and executives one source for market activity and spec share, so territory plans start from evidence. Bring your own territory and see your spec share by state. Schedule a demo and we'll show you how it works on your actual market.
Frequently Asked Questions (FAQs)
What is the difference between construction starts and construction spending?
Construction starts count projects as they break ground. Construction spending measures the dollar value of work completed each month, so it trails starts. Use starts to anticipate demand and spending to confirm it.
Which construction data predicts demand earliest?
Projects in design and bidding show up first, then starts, then spending. Forecast reports add a longer view: ConstructConnect's quarterly Construction Starts Forecast Reports project starts five years out by structure type and state.
What is the difference between spec share and market share?
Market share is based on sales. Specification share is based on how often your products are named in project documents. Spec share moves first, which makes it an early read on where market share is heading.
How often should a BPM review market analytics?
Monthly for starts volume and spec share, and quarterly for regional trends and forecasts. Review more often during a launch or a sharp swing in regional activity.
Do we need a data analyst to use construction analytics?
Not if the software is built for it. A tool like ConstructConnect Analytics is made for anyone to easily interpret the data, without needing analytical expertise.