In short:
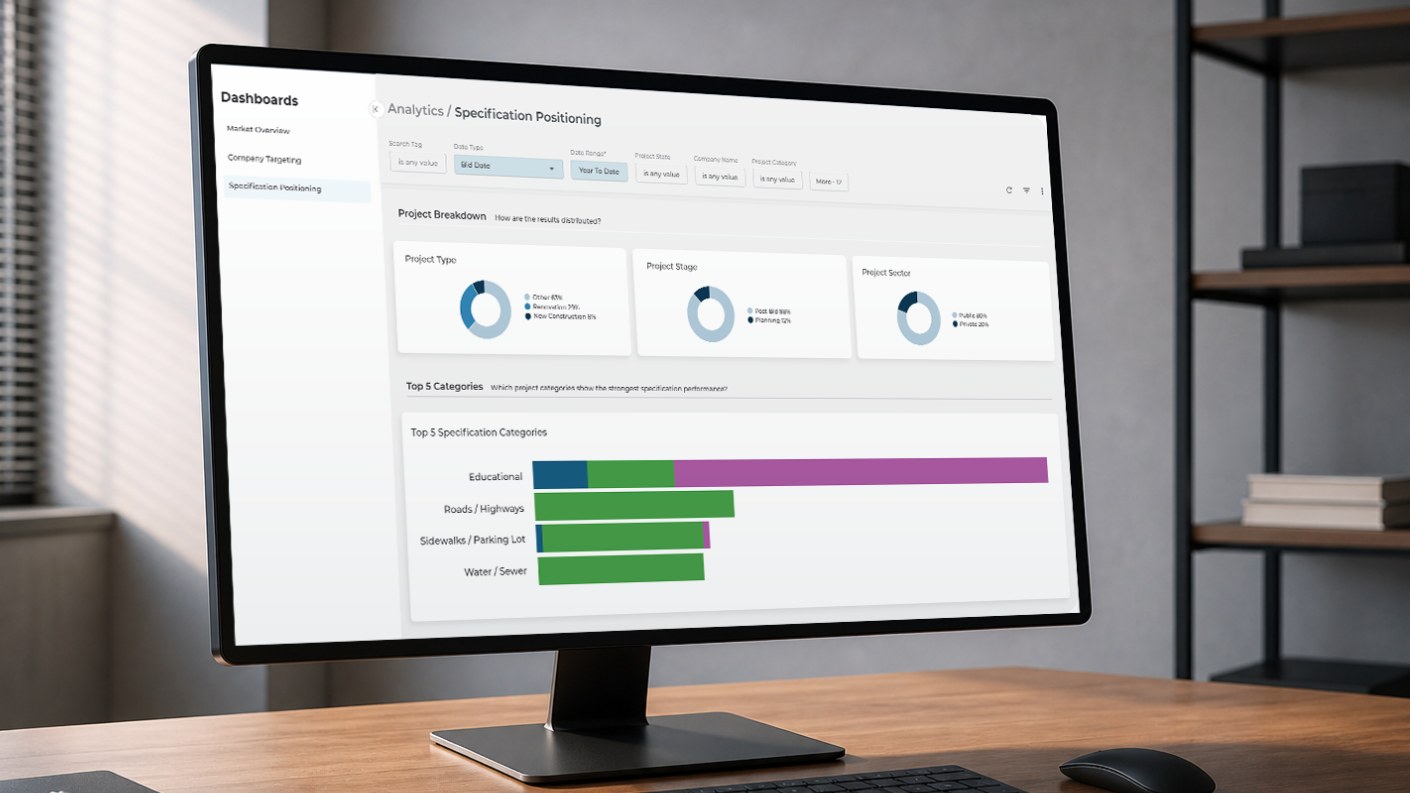
- The Specification Positioning dashboard in ConstructConnect® Analytics shows building product manufacturers (BPMs) exactly where their products are being specified, which architects are driving activity, and where competitors are winning ground.
- Specification share is the upstream metric for market position: by the time specification decisions surface in bids, the window to influence them has already closed.
- BPM sales and marketing teams use it to prioritize territories, benchmark competitors, and build the case for renewal with actual data, not quarterly estimates.
What Is Specification Positioning?
For a building product manufacturer (BPM), specification positioning is your share of architect-written product specifications across a defined set of projects, geographies, and product categories. When an architect names your product in a design document, that's a specification win. When they name a competitor instead, that's a gap that often won't surface until the project hits the bid stage.
Specification decisions typically happen in the design phase, well before a project goes to market. That makes spec share the upstream signal for market position: it's an important metric that helps predict where revenue goes before revenue data reflects it.
Architects are doing more diligence on those decisions than ever. The manufacturers with visibility at that stage and relationships with the right firms have a structural advantage over those waiting to find out where they stood at the end of the quarter.
Why Most BPMs Don't Have a Clear Picture of Their Spec Share
The data exists. The problem is access. For most building product manufacturers, understanding spec share means waiting for someone to compile a quarterly report, one that reflects where you stood three months ago, not today. By the time the data lands, decisions have already been made, and competitors have moved.
That timing gap is the real issue. Since specification decisions are typically made far before a project goes to bid, you need to know if your spec share is slipping in a territory while there's still time to get in front of the right architects.
What Is the Specification Positioning Dashboard?
The Specification Positioning dashboard is a core component of ConstructConnect® Analytics, part of the ConstructConnect® Project Intelligence Premium subscription. It tracks spec activity across user-defined search tags, for your products, product lines, and brand alongside competitor tags, and displays that data across geographies, CSI divisions, project types, and project stages. Unlike static quarterly reports, the dashboard updates continuously, giving building product manufacturers a live view of where their products are being written into specs and where competitors are gaining ground.
What the Specification Positioning Dashboard Shows You
Set up search tags for your products, product lines, or brand alongside the competitor tags you want to benchmark, and the dashboard populates your view automatically.
| Feature |
What It Shows |
When to Use It |
| Specification Share Trends |
How each product or brand is trending over time across the geographies and markets you define |
Spot rising or declining trends before they show up in quarterly reports |
| Specification Share Comparison |
Your search tags and competitor tags ranked by spec share and trend direction |
Benchmark against competitors and identify who's gaining ground |
| Project Breakdown |
Specification activity by project type (new construction, renovation), stage (planning, bidding, post-bid), and sector |
Identify which project categories and stages generate the most specification volume |
| Top 5 Categories |
Project categories ranked by specification performance, with contacts info for projects easily accessible |
Build outreach lists from the firms already driving spec activity in your category |
| AI Dashboard Summary |
A plain-language read of your filtered results calling out the trends and competitive shifts worth your attention |
Get up to speed fast without digging through every chart |
Want to see these feature in action? We're doing a live walkthrough of the Specification Positioning dashboard, along with the other tools inside Analytics, on September 21, 2026. Register for free today.
How BPM Teams Turn Specification Data Into Relationships and Revenue
Architect Relationship Building
The Specification Share Comparison table doesn't just show spec share. It shows which firms are driving it. Identify the architects with the highest spec volume in your category, then work backward: which ones does your team already have relationships with, and which ones are specifying competitors without ever hearing from a rep? One click from the table takes you to a company detail page with contacts and recent projects. The call list builds itself.
Territory Prioritization
Filter by geography to find markets where project volume is high but your spec share is low. Those are the territories where reps should be building architect relationships now, before projects in the pipeline move past the design phase.
Competitive Early Warning
Sort the Specification Share Comparison table by trend direction. Where are competitors trending up while you're flat or slipping? That's the signal to investigate which architects are making the switch, in which project types, and why.
Product Line Decisions
Spec activity by product tag shows which of your lines have momentum and which are fading from designer consideration. That context matters before committing 2027 budget to product marketing or rep coverage.
Renewal Conversations
Going into a customer quarterly business review? Pull up spec share trend data and show how activity has changed over the period. That's a different conversation than a generic ROI slide. You get actual data on what moved.
For more on how Analytics supports BPM go-to-market strategy, see our blog on Analytics for building product manufacturers.
How Do You Get Started With the Specification Positioning Dashboard?
The dashboard is available inside Analytics with the Project Intelligence Premium plan. The first step is defining your search tags. Then add competitor tags alongside yours to see the comparative view.
From there, start with the AI summary at the top of the page. It reads your filtered results and calls out the trends and competitive shifts worth paying attention to.
Then move to the Specification Share Comparison table to benchmark your tags, and the project breakdown charts to understand which project types and stages are driving your specification activity.
For a closer look at how BPM sales teams use specification and project data to build prospect lists, see our guide to researching prospects faster with Analytics.
See the Dashboard Live on September 21
On September 21, we're hosting a live webinar: See 2027 Coming: The Data and Tools Decision-Makers Actually Need. The Analytics team will demo the tools inside Project Intelligence Premium, including the Specification Positioning dashboard. See filters applied, learn different use cases, and get your questions answered during the live Q&A with product experts.
On the agenda:
- How to get a fast read on your market and catch shifts early
- How to track your spec rate and benchmark against competitors
- How to filter and prioritize the architects and markets that deserve your attention
Register today to get an inside look at the tools within Analytics.
Frequently Asked Questions (FAQs)
What is specification positioning in construction?
Specification positioning refers to a building product manufacturer's share of architect-written product specifications across a defined set of projects, geographies, and project types. A higher specification share in a territory means your products are more frequently written into design documents, a leading indicator of downstream sales activity before projects reach the bid stage.
How often does specification data update in the dashboard?
The Specification Positioning dashboard updates continuously as new specification activity is captured across ConstructConnect's project database. You're working with current data rather than a snapshot from three months ago.
Can I track multiple product lines and competitors at the same time?
Yes. You can define tags for individual products, product lines, or brand terms and add multiple competitor tags alongside yours to benchmark directly in the same view.
How does specification share data support sales and marketing alignment?
Specification share data gives both teams a common factual baseline. Sales can prioritize outreach based on which architects and geographies are specifying competitors without existing rep relationships. Marketing can identify which product lines are gaining or losing designer consideration to align content and spend accordingly.