Planned Construction Spending Remained Upbeat Through October
ConstructConnect's Expansion Index shows a 22% increase in the total dollar value of U.S. planned construction projects in October 2022 from a year...

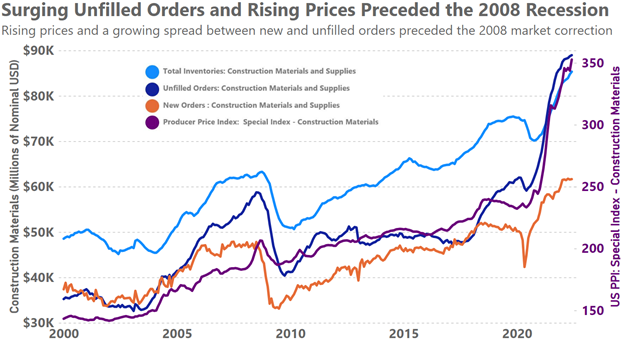
The problem of “you cannot sell what you do not have”—or some variation of that saying—became a near existential problem for many manufacturing and construction firms beginning in 2020. Even today this situation remains a problem for some companies and industries. The data on construction material prices, new orders, and unfilled orders during both the Great Recession of 2007-2009 and since 2020 bear this truth out and much more.
In the year before the Great Recession, the total nominal dollar value of unfilled orders increased by 15% while new orders remained flat (see chart below). It was not until Q4 2007 that prices began to reflect this supply and demand imbalance and the free market started adjusting via rising prices. Between Q4 2007 and Q3 2008 prices for construction materials quickly, but temporarily, rose 12% before returning near their pre-rise levels in mid-2009.
This sequence of events: rising unfilled orders relative to new orders, rising prices, and finally a market correction should be making today’s construction business leaders a bit uneasy. The 15% rise in the dollar value of unfilled orders in 2008 pales in comparison to the 43% increase in unfilled orders between Q1 2020 and Q2 2022—a calculation that minimizes the price change by purposefully overlooking the temporary price dip of mid-2020.
That the current percentage increase in unfilled orders is almost three times greater than in 2008 (43% vs. 15%) and price inflation is four times higher (51% vs. 12%), albeit over a longer time horizon, should be very concerning if a rebalance in the marketplace were to result in a 20-30% decline in the real dollar value of new and unfilled orders, as was the case in 2008.
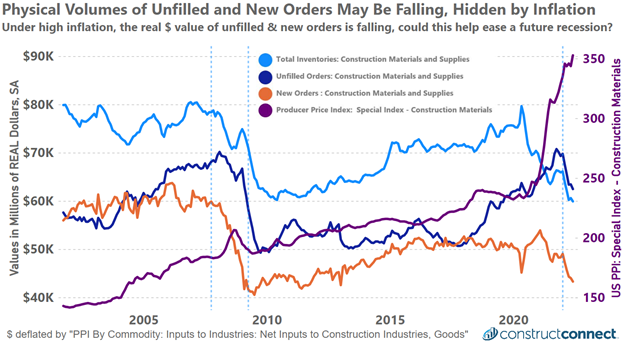
Examining the inflation-adjusted value of unfilled and new orders data may provide a deeper and more accurate look at the flows of new and unfilled orders leading up to, during, and after a recession. In the period before the 2008 recession, the real dollar value of new orders and unfilled orders fell as inflation climaxed. The climax in the real dollar value of new orders (Q2 2007) preceded the comparable climax in unfilled orders (Q1 2008) by nine months.
Furthermore, only the decline in the real value of new orders preceded the start of the Great Recession, and that by six months. In the below graphic a pair of blue dashed lines mark the start and end of the 2008 Great Recession as determined by the National Bureau of Economic Research, a third dashed line at the start of 2020 is only for reference and not representative of an NBER recession pronouncement.
An examination of the data since 2020 bares multiple similarities to 2008’s timeline of events. The most significant parallel is that the real value of new orders for construction materials in the current business cycle began declining in Q2 2021 followed six and nine months later by real declines in unfilled orders and U.S. GDP respectively.
All of these comparisons are only valid if the economic conditions of 2008 and 2020 can be argued as being sufficiently similar to warrant comparison. The origins of the decline in GDP in both instances were different. In 2008, we experienced the near collapse of the financial markets originating in the housing market while that of 2022 originated with a pandemic that caused a financial knee-jerk reaction by the federal government which gave away trillions of borrowed dollars to prop up the economy. In both cases, a rapid surge of new money found its way into the financial system in a way that caused asset prices to rapidly increase. Ultimately these flows put considerable demand pressure on the construction and manufacturing industries.
If one is willing to agree that these surges in demand for infrastructure were caused by exogenous monetary forces, then it may be enough to conclude that the dynamics of the construction market in 2008 can teach us something about the market in 2022. It is unfortunate that the magnitude of the monetary forces which have been unleashed on the construction market in 2022 are drastically greater than in 2008. This is to speak nothing of the supply chain constraints which have added an additional complexity to today’s market challenges.
A note about inventories: Products that are part of present-day new and unfilled orders should have market values and costs which are close to parity, thus offering a clear view of the true dynamics of the construction goods market. In contrast, total inventories data can offer a distorted view of market conditions.
Generally accepted accounting principles use accounting conventions such as lower of cost or market; last in, first out; and first in, first out, which can all distort the true value of inventory, especially during periods of high inflation. Furthermore, the composition of inventory may change throughout the course of a market cycle with antiquated and slower-turning goods constituting a greater or smaller portion of total inventory at any given time, again distorting the true inventory picture.
ConstructConnect's Expansion Index shows a 22% increase in the total dollar value of U.S. planned construction projects in October 2022 from a year...
It’s been 12 years since the Circuit of the Americas COTA first opened near Austin and hosted the F1 United States Grand Prix race, but COTA has...
The Project Stress Index offers construction firms a powerful understanding of the demand environment for new projects.
North America’s major stock market indices are currently well up from the lows they reached in October of last year.