June’s Nonresidential Construction Starts +26% M/M, +11% Y/Y, and +5% YTD
ConstructConnect announced June 2023’s volume of nonresidential construction starts was $63.2 billion, up +25.5% versus May 2023’s $50.3 billion.

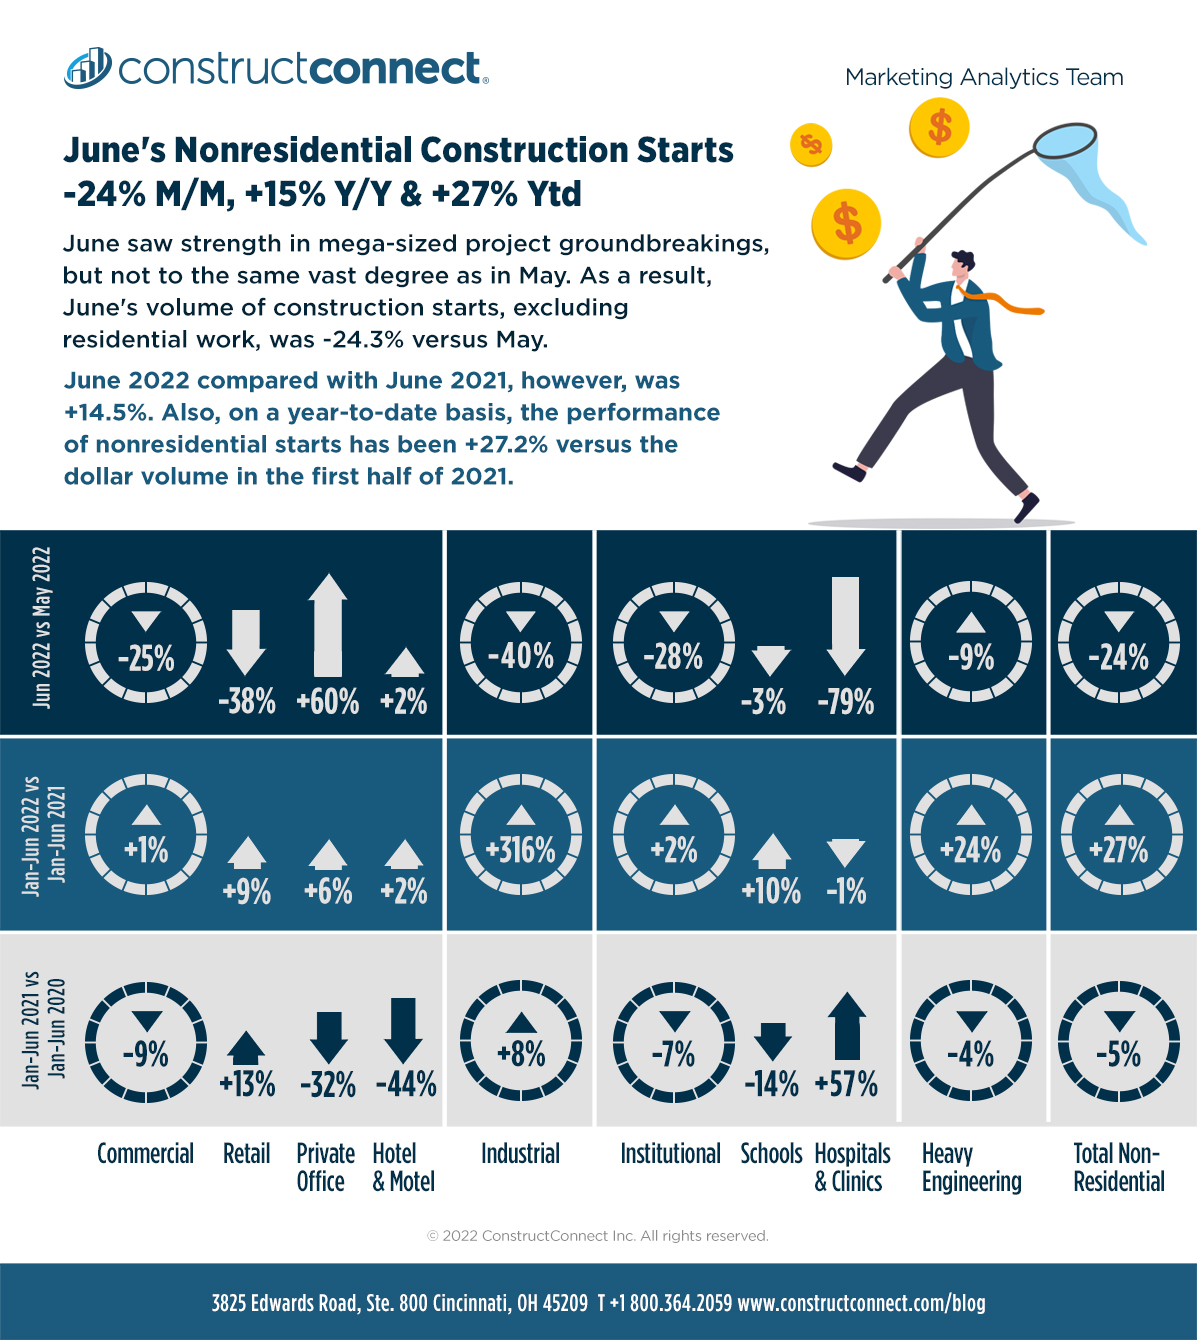
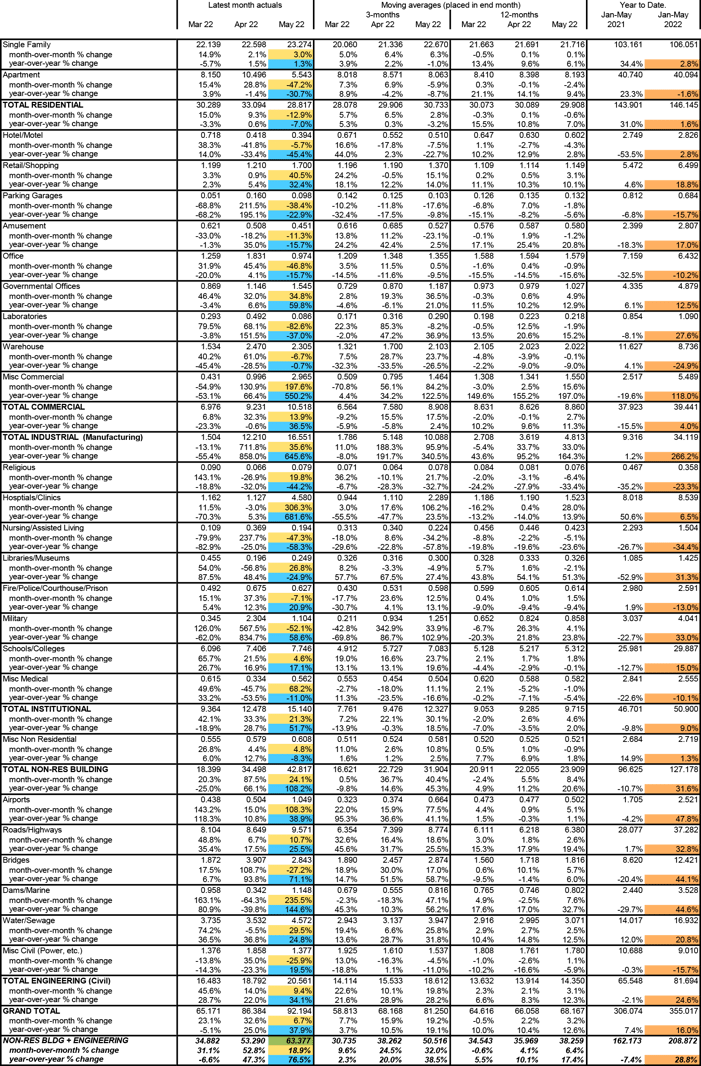
ConstructConnect announced today that June 2022's volume of construction starts, excluding residential work, was $47.5 billion (green shaded box, bottom of page 11), a decrease of -24.3% versus May’s figure of $62.7 billion (previously reported as $63.4 billion). The sizable drop was to be expected, given that May had such an exceptional array of mega-sized project groundbreakings.
A project is considered to be a mega when its estimated value is $1 billion or more. In the first quarter of this year, there was only one such project for an estimated $2 billion. In Q2, however, the floodgates opened. In April, there were five megas for $17.0 billion; in May, a lower number, four, but a higher dollar amount, $20.0; and in June, three for nearly $8.0 billion (see Top 10 projects list on page 8.)
View this information as an infographic.
Click here to download the complete Construction Industry Snapshot Package - June 2022 PDF.
Among mega projects in April and May, there were two that stood out from the others for being in double-digit billions of dollars, an LNG facility in Louisiana for Tellurian and a computer wafer manufacturing plant in the Lone Star State for Texas Instruments. June’s largest project start was the BlueOvalSK Battery Plant in Glendale, Kentucky, for Ford Motor Company and SK Innovation, a South Korean joint-venture partner.
June 2022’s total dollar volume of nonresidential construction starts when compared with June 2021 was a respectable +14.5%. The year-to-date total dollar volume of nonresidential construction starts in 2022 has been ahead by more than a quarter, +27.2%, a quite robust improvement.
With rapid price advances (i.e., inflation) still in full swing and interest rates in the ascendant, there’s good reason for much talk about recession, at least concerning the consumer spending and housing start side of the economy. But in nonresidential construction, there’s an inventory of upcoming super-sized projects that may see it through the hopefully temporary hard times.
The kinds of huge undertakings working their way past mere planning stages include expansions of electric vehicle manufacturing capacity; new battery and computer chipmaking plants; rapid transit and rail infrastructure; and raw materials development and oil, natural gas, and electric power works.
To complete the starts picture, the GRAND TOTAL (i.e., adding residential to nonresidential activity) in June 2022 was -13.1% m/m, +3.6% y/y and +14.8% ytd.
There are three major subcategories of total starts: residential, nonresidential building, and heavy engineering/civil. On a year-to-date percentage-change basis in June 2022, nonresidential building and engineering starts both performed admirably, +29.0% and +24.4% respectively. Residential was stuck in neutral, +0.7%.
On a month-to-month basis in May, nonresidential building starts were out front, +24.1%, followed by engineering, +9.4%, with residential stumbling somewhat, -12.9%.
But it was residential that was leading on a month-to-month basis in June, +12.1%. Nonresidential building and engineering were unable to keep up with their buoyant results from May. They were -31.7% m/m and -8.7% m/m respectively.
Other statistics often beloved by analysts are trailing twelve-month (TTM) results and these are set out for all the various type-of-structure categories in Table 10.
Grand Total TTM starts in June 2022 on a month-to-month basis were +1.3%, a slowing of the pace from both May’s +6.1% and April’s +4.4%.
On a year-over-year basis in June 2022, GT TTM starts were +19.9%, beating both May’s +18.8% and April’s +11.6%.
Starts compile the total estimated dollar value and square footage of all projects on which ground is broken in any given month. They lead, by nine months to as much as two years, put-in-place (PIP) statistics which are analogous to work-in-progress payments as the building of structures proceeds to completion.
PIP numbers cover the universe of construction, new plus all manner of renovation activity, with residential traditionally making up two-fifths (about 40%) of the total and nonresidential, three-fifths (i.e., the bigger portion, at around 60%).
Over the past several years, however, the mix has undergone a massive and startling shift. In 2021’s full-year PIP results, the residential to nonresidential relationship was about half and half. Through May of this present year, 2022, the ratio, on a not seasonally adjusted (NSA) basis, has swung even more in residential’s favor, 53.0% to 47.0%.
The January-May 2022 over January-May 2021 total dollar volume of PIP construction was +11.0%, with residential at +21.6% and nonresidential, a minimal +1.0%. As the second half of 2022 arrives, and the months tick by, the big disparity in gains will almost certainly narrow.
PIP numbers, being more spread out, have smaller peak-over-trough percent-change amplitudes than the starts series. As an additional valuable service for clients and powered by its extensive starts database, ConstructConnect, in partnership with Oxford Economics, a world leader in econometric modeling, has developed put-in-place construction statistics by types of structure for U.S. states, cities, and counties, actuals, and forecasts. ConstructConnect’s PIP numbers are being released quarterly and are featured in a separate report.
Construction’s share of U.S. total nonfarm employment in the monthly Employment Situation report is slightly more than 5.0%. To claim its proportional share of June’s economywide number-of-jobs increase, +372,000, the figure for construction would have needed to be +19,000. Instead, it was weaker at +13,000. Nevertheless, the year-to-date monthly average of construction employment is now +21,000 jobs versus +3,000 in H1 2021. In June 2022, nonresidential subcontractors accounted for almost all (+11,000) the month-to-month climb in the total construction jobs count.
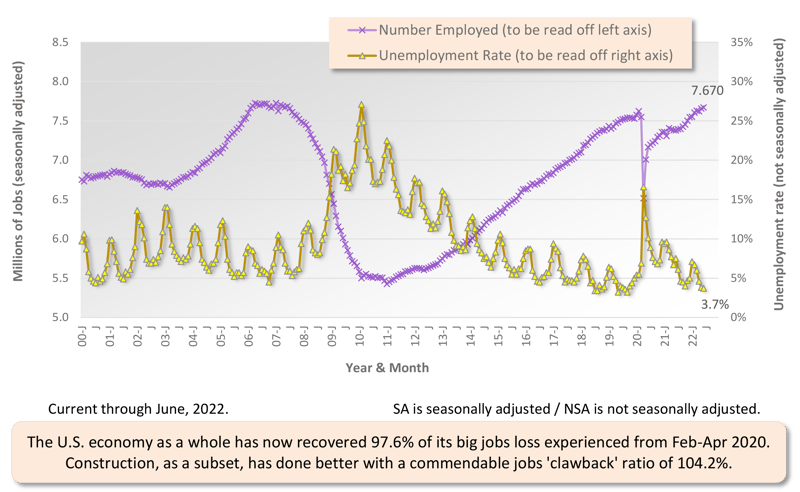
Rarely does construction as a subset record a not seasonally adjusted (NSA) unemployment rate that is lower than for all jobs, but that’s what happened in June, 3.7% compared with 3.8%. In June a year ago, construction was looking at an NSA U rate that was twice as high, 7.5%.
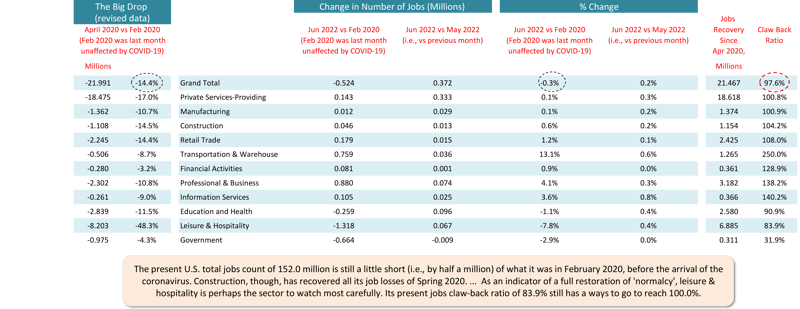
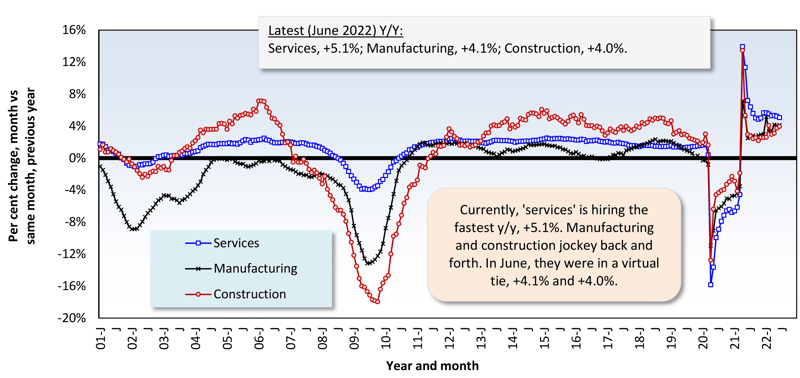
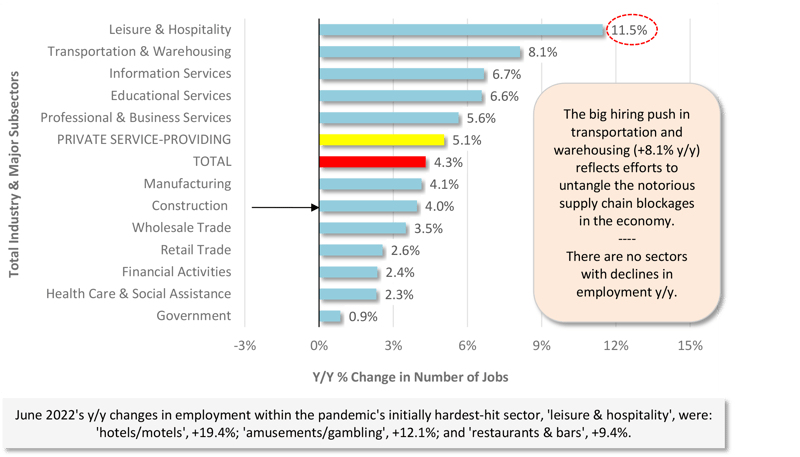
The construction sector has recovered all the jobs (104.2%) it shed between February and April 2020 when the coronavirus initially sent the economy reeling. The jobs claw-back ratio for all jobs (97.6%), though, isn’t all the way back yet. Manufacturing is at 100.9%. As for year-over-year jobs-count percentage changes, neither manufacturing, +4.1%, nor construction, +4.0%, are doing quite as well as all jobs, +4.3%. But the +4.3% is being boosted by the sector that fell into the deepest hole in Spring 2020, leisure and hospitality, where the number of jobs in latest June was +11.5% y/y.
In other segments of the economy with close ties to construction, the latest y/y percentage changes in employment have been as follows: oil and gas exploration and development, +19.8%; machinery and equipment rental and leasing, +10.3%; architectural and engineering design services, +6.1%; real estate, +3.9%; cement and concrete product manufacturing, +3.4%; and building materials and supplies dealers, -2.5%. Only the latter is disappointingly downbeat.
Design services work leads to later onsite activity. Therefore, the +6.1% increase for design services jobs is a positive read on the prospects for future hardhat employment. Furthermore, the latest (May 2022) Architecture Billings Index from the American Institute of Architects, which provides a gauge of the demand for construction design services, stayed healthy at 53.5, above the 50.0 benchmark figure that separates more sales from less, month to month.
Graph 1: Change in Level of U.S. Construction Employment, Month to Month (M/M) −
Total & by Categories - June 2022
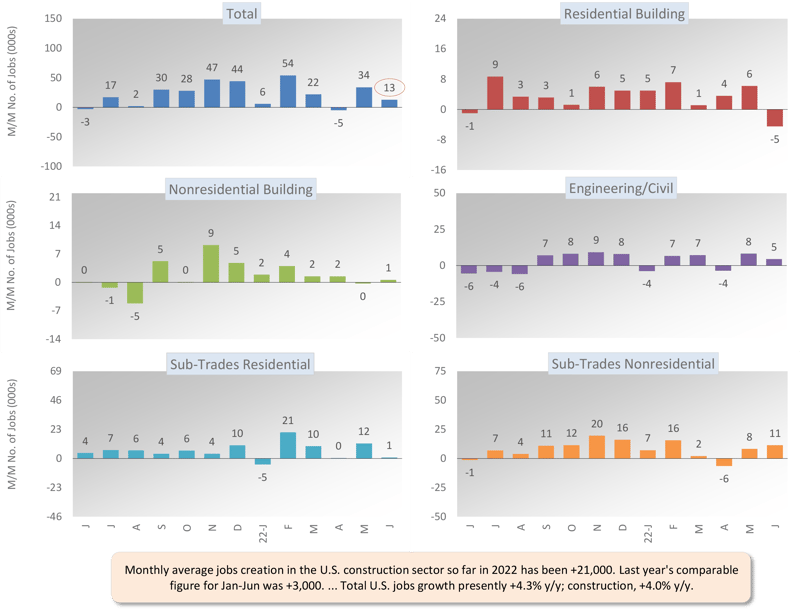
Table 2: Monitoring the U.S. Employment Recovery - June 2022
Graph 2: U.S. Employment May 2022 - % Change Y/Y
Based on Seasonally Adjusted (SA) Data
Graph 3: Y/Y Jobs Change, U.S. Total Industry & Major Subsectors — June 2022 (Based on Seasonally Adjusted Payroll Data)
Graph 4: U.S. Construction Employment (SA) & Unemployment Rate (NSA)
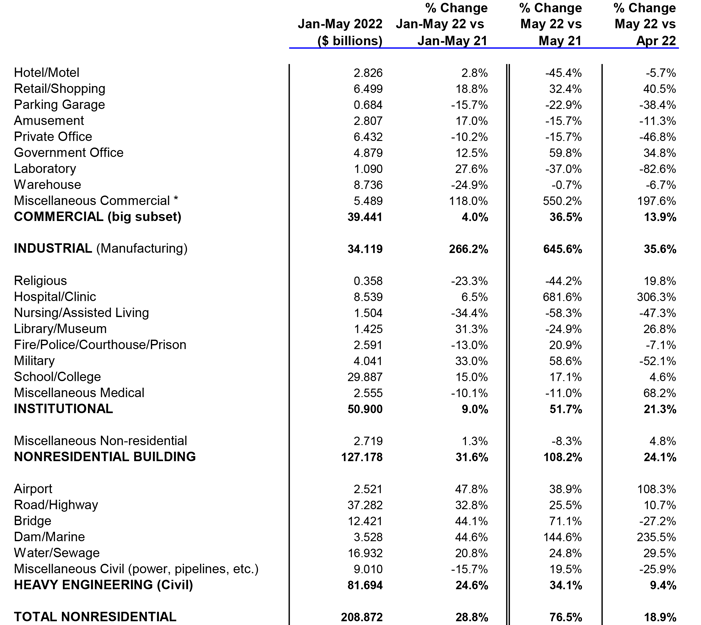
June 2022’s -24.3% month-to-month (m/m) decline in total nonresidential starts originated mainly in the industrial type-of-structure category (-40.0%), with substantial pullbacks also occurring in institutional (-28.2%) and commercial (-24.6%). By comparison, engineering’s drop (-8.7%) appears minor.
The +14.5% jump in total nonresidential starts, June of this year versus June of last year (y/y), was owing to bumps in industrial (+585.3) and engineering (+23.1%), as both commercial (-24.5%) and institutional (-24.4%) were down by a quarter.
As for June’s year-to-date step forward of +27.2% for total nonresidential starts, it centered on industrial (+315.9%) and engineering (+24.4%), as both commercial (+0.8%) and institutional (+1.9%) have shown little forward progress.
There are two dominant subcategories of total nonresidential starts. When the volumes of roads/highways and schools/colleges are added together, they accounted for nearly one-third of total year-to-date nonresidential activity in June 2022 (i.e., shares of 17.6% and 14.4% respectively, summing to 31.9%).
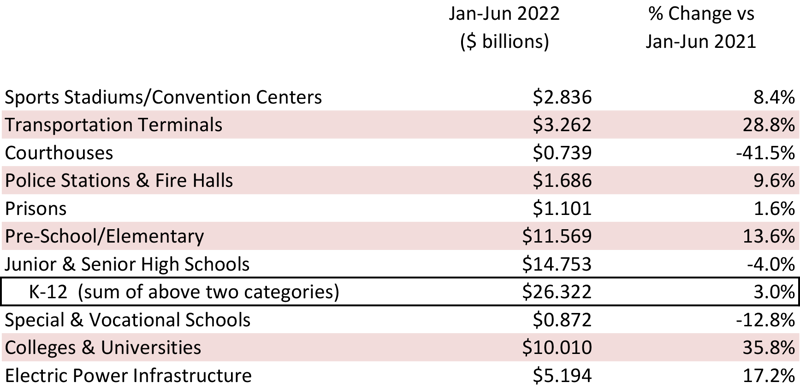
The three percentage-change metrics for street starts in June 2022 were -14.4% m/m, but +20.2% y/y and +30.3% YTD. Educational facility starts were -2.6% m/m and -7.4% y/y, but +9.6% YTD. Dissecting school starts further, there have been good year-to-date improvements at the levels of colleges and universities, +35.8%, and preschool and elementary, +13.6%.
Also important within the engineering subcategory are water/sewage and bridge starts, and they have had fine, verging on stellar, year-to-date performances, +22.7% and +46.6% respectively.
For the three medical subcategories combined, i.e., hospital/clinic, nursing/assisted living, and miscellaneous medical, June 2022’s starts were distressingly weak, -67.9% m/m, -47.9% y/y, and -8.6% YTD. Hospital/clinic starts on their own, though, are holding up okay year to date, -0.8%. (There were three big hospital project groundbreakings a month ago in May.)
Among commercial starts in June, notable year-to-date increases have been recorded by miscellaneous, +18.4%, and government offices, +19.2%. Miscellaneous includes transportation terminal starts which, on their own, are +28.8% YTD. Three subcategories, which have experienced rough rides over the last several years, are showing small year-to-date revivals: retail/shopping, +8.6%; private office buildings, +5.7%; and hotels/motels, +2.3%. New warehouse construction, at -26.0% YTD for starts, has been put on the back burner.
Table 3: Construction Starts in Some Additional Type of Structure Subcategories
This Industry Snapshot sets out the history, from January 2005 to the present, of 12-month moving ConstructConnect starts averages for a dozen construction types of structures. The moving average (placed in the latest month) approach is designed to capture trends.
All the graphs appear somewhat encouraging. There are a few sideways movements in the latest month (i.e., for retail, schools/colleges, and hospitals/clinics), but in nearly all other instances, recent upticks in the curves prevail.
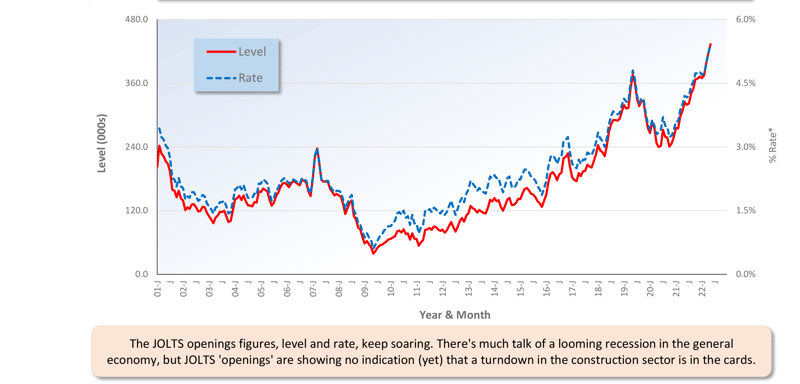
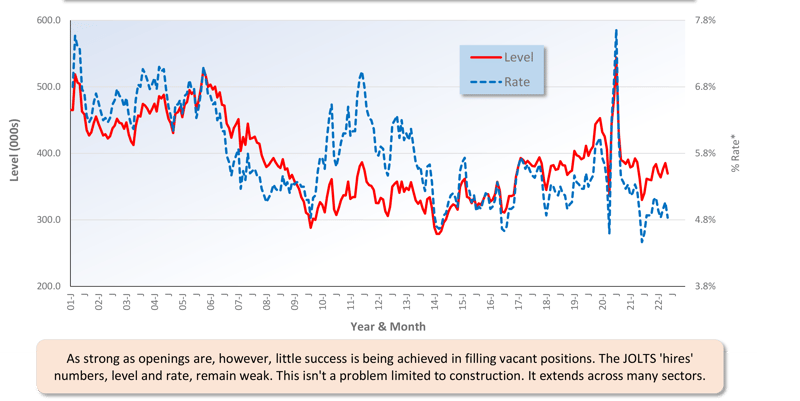
For ease of viewing, Graphs 5 and 6 show smoothed curves (i.e., based on three-month moving averages) for the JOLTS results, openings and hires, pertaining to construction.
Openings in construction have reached new peaks (both as a level and rate), but the hires figures (level and rate) are staying mostly low and flat. The construction sector is in a contest with most other sectors throughout the economy to fill positions amidst a severe available worker shortage.
If compensation is a deciding factor in signings, construction may have once been lagging a bit in its offerings, but as the next section spotlights, that no longer seems to be the case.
Graph 5: U.S. Construction Job Openings (from JOLTS Report)
(3-month Moving Averages placed in Latest Month)
Graph 6: U.S. Construction Job Hires (from JOLTS Report)
(3-month Moving Averages placed in Latest Month)
Tables B-3 and B-8 of the monthly Employment Situation report, from the BLS, record average hourly and average weekly wages for industry sectors. B-3 is for all employees (i.e., including bosses) on nonfarm payrolls. B-8 is for production and nonsupervisory personnel only (i.e., it excludes bosses). For all jobs and construction, there are eight relevant percentage changes to consider.
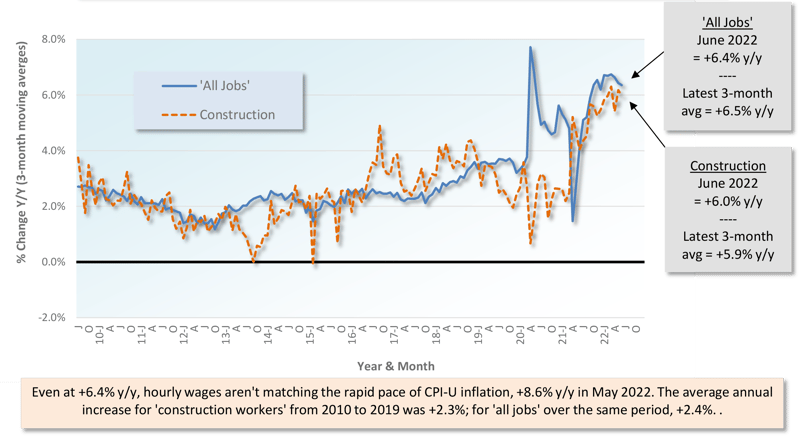
From June 2022’s Table B-3 (including bosses), year-over-year all-jobs earnings were +5.1% hourly and +4.2% weekly. Construction workers, as a subset of all jobs, were out front on both counts, +5.6% hourly and +5.8% weekly. From Table B-8 for production and nonsupervisory workers (i.e., excluding bosses), the all-jobs compensation hikes were +6.4% hourly and +5.4% weekly. Construction workers fell a little behind hourly, +6.0%, but leaped ahead weekly, +7.3%.
Graph 7: Average Hourly Earnings Y/Y - All Jobs & Construction
Graph 8: Average Weekly Earnings Y/Y - All Jobs & Construction
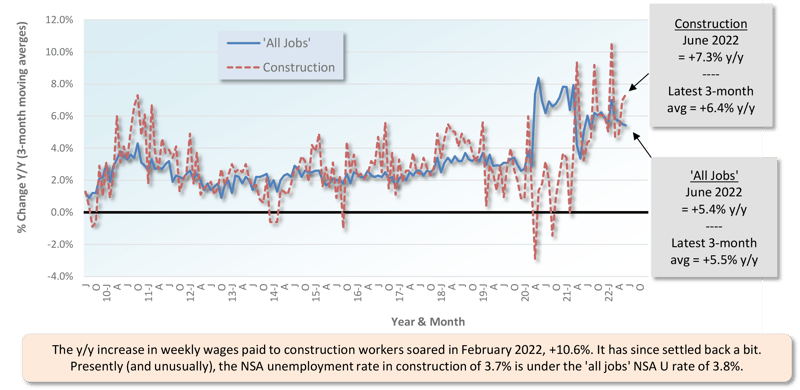
Table 4: 2022 YTD Ranking of Top 20 States by $ Volume of Nonresidential Construction Starts — ConstructConnect®
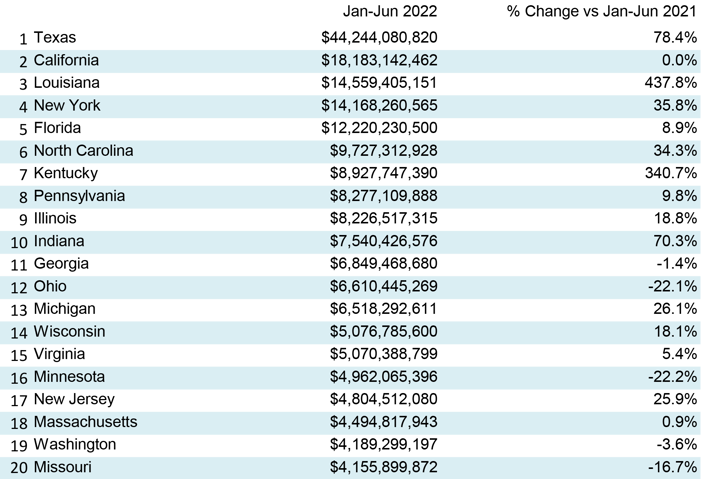
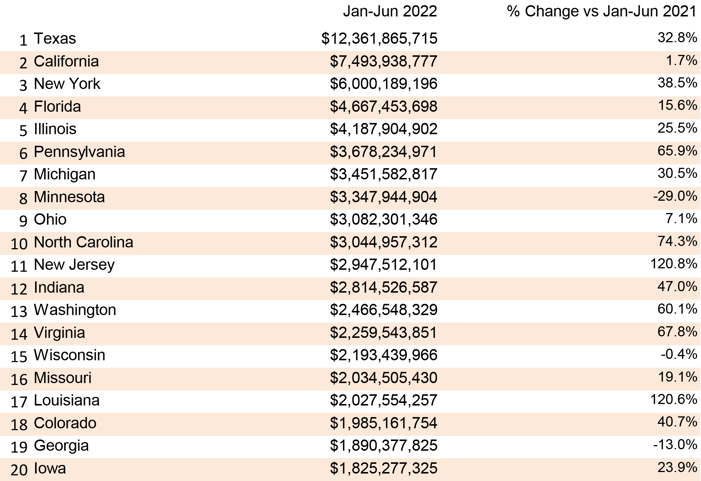
Table 5: 2022 YTD Ranking of Top 20 States by $ Volume of Nonresidential Building Construction Starts — ConstructConnect®
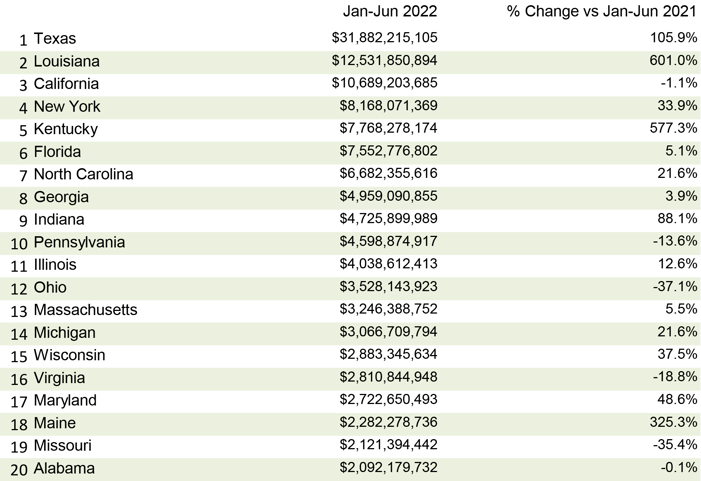
Table 6: 2022 YTD Ranking of Top 20 States by $ Volume of Heavy Engineering/Civil Construction Starts — ConstructConnect®
May 2022’s y/y results for three building related BLS Producer Price Index (PPI) series were: (A) construction materials special index, +15.7% (an easing from April’s +17.8%); (B) ‘inputs to new construction index, excluding capital investment, labor, and imports, +17.0% (under the previous month’s advance of +20.7%); and (C) ‘final demand construction, designed to capture bid prices, +19.0% (not quite as bullish April’s +19.3%).
(A) comes from a data series with a long history, but it’s confined to a limited number of major construction materials. (B) has a shorter history, but it’s more comprehensive in its coverage, although it includes some items (e.g., transportation) that aren’t strictly materials.
What’s important to know, though, is that the y/y change in the bid price index (+19.0%) has caught up with, and moved beyond, the average y/y change for the two material input cost indices ((15.7% + 17.0%)/2 = +16.4%). There were times around a year into the pandemic when contractors weren’t remotely adjusting their prices enough to recover material cost increases.
Concerning the cost of some major construction material inputs, as revealed in the PPI data set published by the BLS, diesel fuel is +84.9% y/y; asphalt, +80.5%; hot rolled steel bars, plates, and structural shapes, +36.8%; aluminum sheet and strip, +28.4%; gypsum, +22.6%; ready-mix concrete, +9.5%; copper wire and cable, +8.2%; cement, +6.8%; and softwood lumber, -21.7%. There’s also an inputs to highways and streets PPI index and it’s +19.6% y/y.
The value of construction starts each month is derived from ConstructConnect’s database of all active construction projects in the United States. Missing project values are estimated with the help of RSMeans’ building cost models. ConstructConnect’s nonresidential construction starts series, because it is comprised of total-value estimates for individual projects, some of which are super-large, has a history of being more volatile than many other leading indicators for the economy.
ConstructConnect’s total residential starts in June 2022 were +12.1% m/m, -9.4% y/y, and +0.7% ytd. Multi-family starts in June were -13.6% m/m, -32.4% y/y and -1.0% ytd. Single-family starts were +20.7% m/m, -1.5% y/y and +1.3% ytd.
Including home building with all nonresidential categories, Grand Total starts in June 2022 were -13.1% m/m, but +3.6% y/y and +14.8% ytd.
ConstructConnect adopts a research-assigned start date. In concept, a start is equivalent to ground being broken for a project to proceed. If work is abandoned or rebid, the start date is revised to reflect the new information.
The year 2022 marks at least the fourth time since 2007 that Russia has used energy shipments as leverage to achieve a political objective across one or more European nations, according to research conducted by Rice University’s Baker Institute for Public Policy. What is unique in this latest bout, however, is the scope of nations involved in the dispute. Among them are France, which as of mid-June was no longer receiving any natural gas from Russia, and Germany, which is receiving only reduced supplies and faces the threat of having no heating gas going into the winter. Most blatantly, in May Russia halted all gas exports to Finland just days after that country announced its intention to join NATO.
These actions along with the threat of future escalations have placed a dark cloud over Europe’s economic outlook for the foreseeable future. EU natural gas import prices at the end of June were $34.35 per million BTUs, a three-fold increase from a year ago ($10.30) and up nearly 19-fold over the past two years ($1.75) according to data from the World Bank. For building product manufacturers in North America who are paying only a minor fraction of the price for energy as their European peers, this presents an opportunity to supply goods—and, in particular, energy-intensive goods—to a welcoming geographic market looking for lower costs. While the overall situation in Europe is entirely regrettable, the region’s energy and production constraints are creating a unique opportunity for North American firms. - Michael Guckes, Senior Economist
The economy may be in recovery mode, but nonresidential work is usually a lagging player. Companies are hesitant to undertake capital spending until their personnel needs are rapidly expanding and their office square footage or plant footprints are straining capacity. Also, it helps if profits are abundant. (Today’s greater tendency to work from home has made office occupancy much more difficult to assess.)
Each month, ConstructConnect publishes information on upcoming construction projects at its Expansion Index.
The Expansion Index, for hundreds of cities in the United States and Canada, calculates the ratio, based on dollar volume, of projects in the planning stage, at present, divided by the comparable figure a year ago. The ratio moves above 1.0 when there is currently a larger dollar volume of construction prospects than there was last year at the same time. The ratio sinks below 1.0 when the opposite is the case. The results are set out in interactive maps for both countries.
Click here to download the Construction Industry Snapshot Package - June 2022 PDF.
Click here for the Top 10 Project Starts in the U.S. - June 2022.
Click here for the Nonresidential Construction Starts Trend Graphs - June 2022.
Table 1: Value of United States Nonresidential Construction Starts May 2022 - ConstrucConnect
*Includes transportation terminals and sports arenas.
Source: ConstructConnect Research Group and ConstructConnect.
Table: ConstructConnect.
Table 7: Value of United States Construction Starts
ConstructConnect Insight Version – May 2022
Arranged to match the alphabetical category drop-down menus in Insight
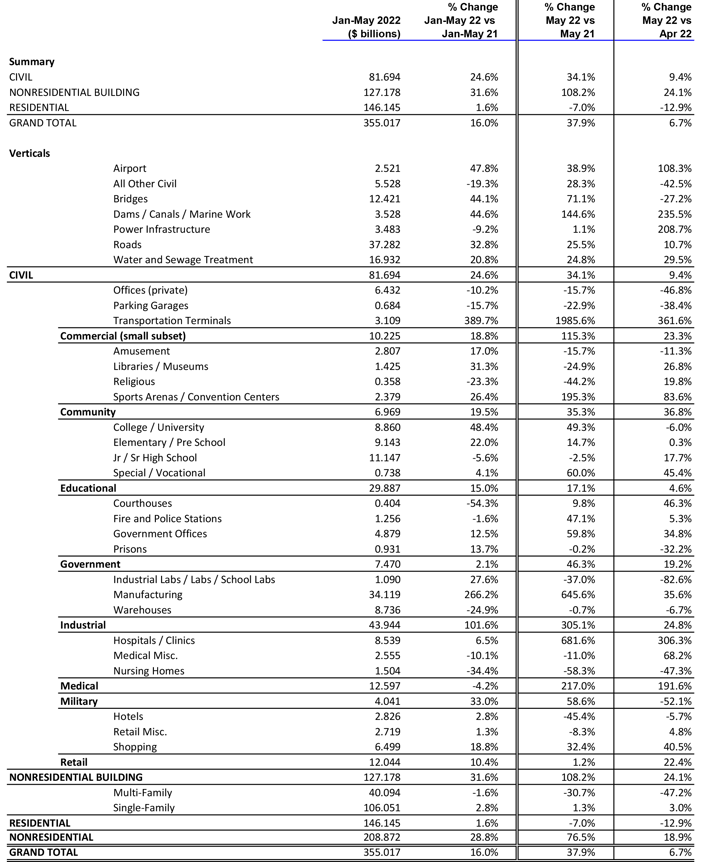
Table 2 conforms to the type-of-structure ordering adopted by many firms and organizations in the industry. Specifically, it breaks nonresidential building into ICI work (i.e., industrial, commercial, and institutional), since each has its own set of economic and demographic drivers. Table 3 presents an alternative, perhaps more user-friendly and intuitive type-of-structure ordering that matches how the data appears in ConstructConnect Insight.
Source: ConstructConnect.
Table: ConstructConnect.
Table 9: U.S. YTD Regional Starts
Nonresidential Construction* — ConstructConnect
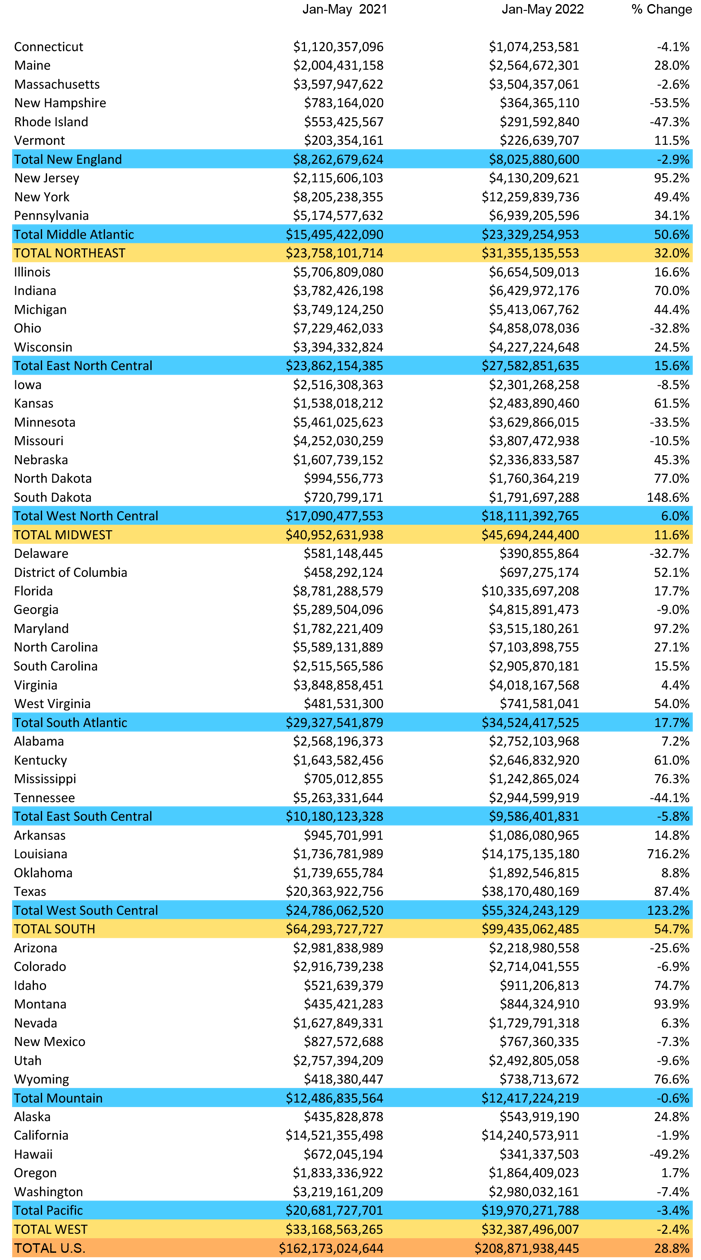
Data Source and Table: ConstructConnect.
Table 9:Value of United States National Construction Starts – May 2022 – ConstructConnect
Billions of current $s, not seasonally adjusted (NSA)
*Figures above are comprised of nonres building and engineering (i.e., residential is omitted).
Data Source and Table: ConstructConnect
ConstructConnect announced June 2023’s volume of nonresidential construction starts was $63.2 billion, up +25.5% versus May 2023’s $50.3 billion.
Below are six graphs recording 12-month moving averages of ConstructConnect’s nonresidential construction starts.
Below are six graphs recording 12-month moving averages of ConstructConnect’s nonresidential construction starts.
ConstructConnect Releases June 2024 Nonresidential Construction Starts