January's Nonresidential Construction Starts +14% M/M and +67% Y/Y
ConstructConnect announced today that January 2023’s volume of nonresidential construction starts was $57.0 billion versus December’s $50.0 billion.

ConstructConnect announced today that June 2023’s volume of construction starts, excluding residential work, was $63.2 billion, an increase of +25.5% versus May 2023’s figure of $50.3 billion (originally reported as $49.2 billion).
The increase in dollar volume from one month to the next was partly a function of seasonality. Warmer summer weather inspires more fieldwork activity. But the major push to starts came from an exceptional tally of mega-sized projects, those valued at a billion dollars or more each.
Click here to download the complete Construction Industry Snapshot Package - July 2023 PDF.
The total dollar volume of mega projects in June of this year, at $14.6 billion, did not set a record. That distinction belongs to May of last year when four megas added to $20.0 billion. What has separated June of this year apart from every other month in history, however, was the number of mega projects. This time around, in the Top 10 projects list, nearly every one of them was a megaproject. They accounted for nine of the ten projects listed. (It should also be mentioned that the 15 biggest projects in June of this year all carried price tags above $500 million.) The highest previous number of megas in the Top 10 was six in July 2022.
Nor were the megas in the latest month confined to a single type of structure category, as they have sometimes been lately, with manufacturing predominating. Yes, there were a couple of manufacturing megas in June, but there were also major undertakings in electric power (Wyoming and Texas), arenas (Buffalo Bills stadium), and by the military (dry dock in Hawaii).
June 2023 total nonresidential starts compared with June 2022 were +11.0%. The latest year-to-date result for total nonresidential starts, versus Jan-June 2022 (or first half 2022), was +4.6%.
To complete the overview picture, the GRAND TOTAL dollar volume (i.e., adding residential to nonresidential activity) of starts in June 2023 was +11.6% m/m, -7.1% y/y, and -8.5% YTD. Weakness in residential starts (-27.4% YTD) has been holding back Grand Total starts YTD.
There’s an important sidebar concerning the jumps in material costs, wage levels, and bid prices that are reviewed in this report. Year-over-year comparisons fall short of conveying the cumulative impacts over the past several years. Estimated values for construction projects have risen by as much as a third since before the beginning of the pandemic. This should not be overlooked when the discussion turns to the proliferation in the number of mega projects.
Other statistics often beloved by analysts are trailing twelve-month results and these are set out for all the various type-of-structure categories in Table 9 of this report.
Grand Total TTM starts in June, on a month-to-month basis, were -0.7%, continuing a downward trend, but to a less negative degree, than in May, -2.7%, or April, -2.8%.
On a year-over-year basis, Grand Total TTM starts in June stayed on the plus side of change, +3.1%, but they prolonged the slide from May’s +6.0% and April’s +13.7%.
Starts compile the total estimated dollar value and square footage of all projects on which ground is broken in any given month. They lead, by nine months to as much as two years, put-in-place statistics from the Census Bureau, which are analogous to work-in-progress payments as the building of structures proceeds to completion.
PIP numbers cover the universe of construction, new plus all manner of renovation activity, with residential traditionally (i.e., over the decade preceding the pandemic) making up two-fifths (about 40%) of the total, and nonresidential, three-fifths (i.e., the bigger portion, at around 60%).
In 2021 and 2022, there were dramatic changes in the proportional shares of the total put-in-place dollar volumes taken by residential versus nonresidential. In 2021’s full-year PIP results, the relationship was about half and half, with residential at 49.4% and nonresidential, at 50.6%. In 2022, residential finally succeeded in claiming the larger share of the total, 50.7% to 49.4% for nonresidential.
This altered relationship, given the boosts to interest rates, could not be expected to last. Higher interest rates, which harm affordability, have an almost immediate negative impact on housing demand. True to historical form, residential’s year-to-date share of total PIP dollars through May of this year has retreated to 45.6%. (Through May of last year, its share was 52.1%.)
The reported PIP numbers from the Census Bureau are always a month behind the starts data. The total dollar volume of construction put-in-place through May of this year has been +2.9%, with residential throwing snake eyes, -9.9%, while nonresidential’s on a winning streak, +16.9%.
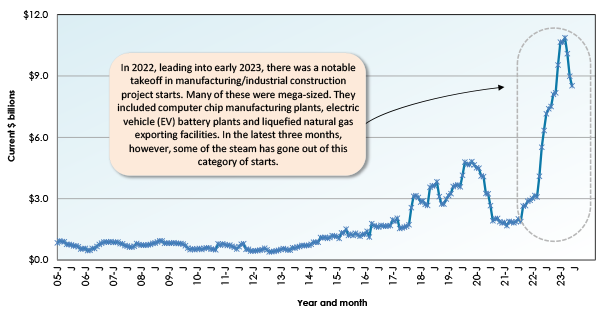
Nonresidential construction’s leading PIP subcategory for year-to-date percentage change (2023/2022) has been manufacturing, an impressive +72.2%. Also, by dollar volume YTD, manufacturing has moved up to become the largest subcategory among the PIP nonresidential stats.
Other PIP subcategories recording significant YTD gains have been lodging, +26.7%; waste disposal and water delivery, +19.9%; highway and street, +13.9%; and health care, +13.6%.
PIP numbers, being more spread out, have smaller peak-over-trough percent-change amplitudes than the starts series. As an additional valuable service for clients and powered by its extensive starts database, ConstructConnect, in partnership with Oxford Economics, a world leader in econometric modeling, has developed put-in-place construction statistics by types of structure for U.S. states, cities, and counties, actuals and forecasts. ConstructConnect’s PIP numbers are released quarterly and are featured in a separate reporting system.
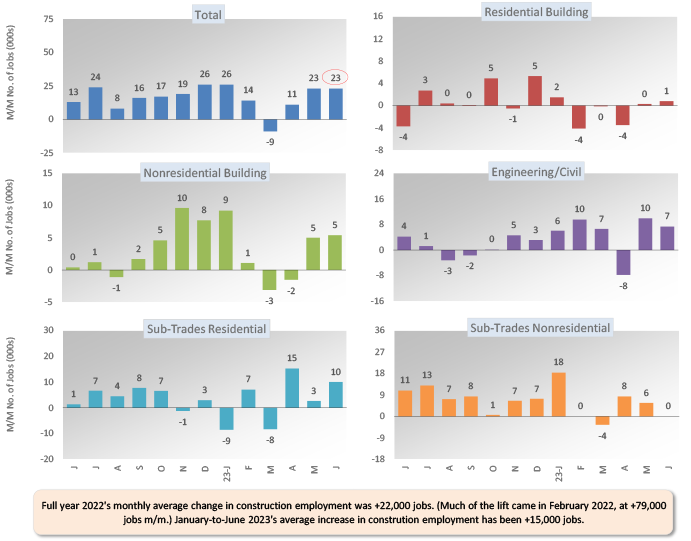
Construction’s share of U.S. total nonfarm employment in the monthly labor market report issued by the Bureau of Labor Statistics is slightly more than 5.0%. Accordingly, to claim its rightful portion of June’s +209,000 economywide number-of-jobs advance, the figure for construction would have needed to be +11,000. At an actual figure of +23,000, that target was bested by more than double. Graph 1 shows that month-to-month hiring in June was most active among engineering/civil contractors (+7,000) and at the residential subcontractor trade level (+10,000).
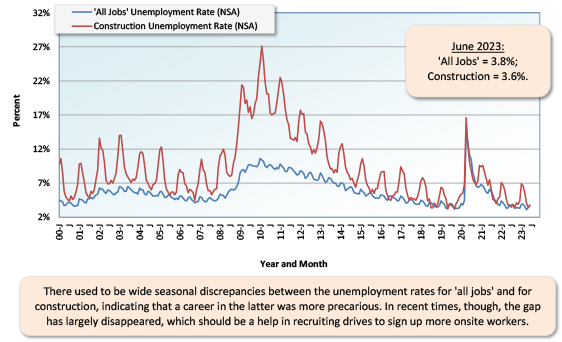
Construction’s not seasonally adjusted (NSA) unemployment rate in June was 3.6%, up slightly from May’s 3.5% but down a touch from June 2022’s 3.7%. The lowest NSA unemployment rate recorded by the sector has been 3.2%, achieved on several occasions, most recently in September 2019. Graph 3 renders the seasonality of construction’s U rate readily apparent.
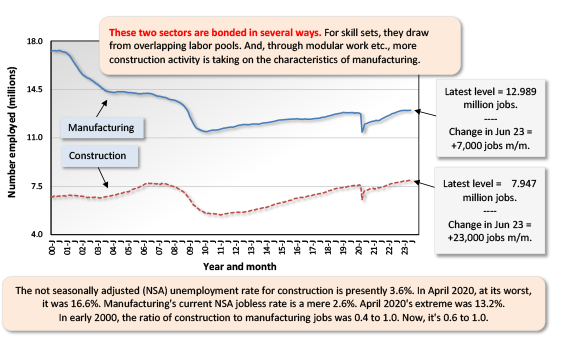
June’s NSA U rate for construction of 3.6% was below the nation’s all jobs figure of 3.8%. It was, however, above manufacturing’s 2.6%. Both the manufacturing and construction sectors are in the goods-producing segment of the economy (i.e., as opposed to private services-providing), and there is considerable overlap between their labor pools. Staffing by manufacturers in June took a relatively modest step forward, +7,000 jobs (Graph 2). The massive amount of capital spending that is currently being undertaken by manufacturers will, in lagged fashion, translate to more jobs, although ever-greater adoption of automation and robotics will act as restraints.
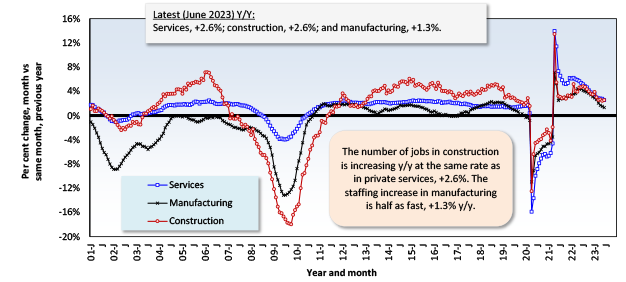
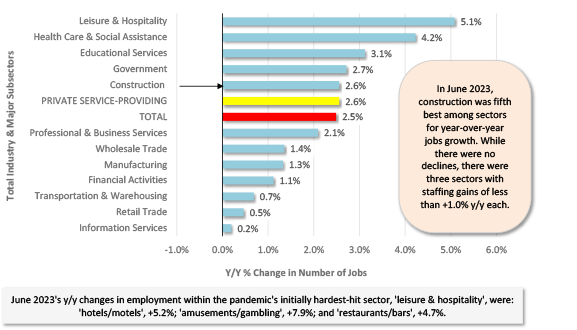
In June, U.S. total employment was +2.5% year over year. Private services-providing jobs were up a shade more, +2.6% y/y. Construction’s worker count y/y, at +2.6%, was tied with services. Manufacturing’s hiring was slower at +1.3% y/y. Setting the fastest year-over-year pace for jobs growth among all industrial sectors was leisure and hospitality, +5.1% (see Graph 5).
In other segments of the economy with close ties to construction, the latest y/y changes in employment were as follows: architectural and engineering design services, +5.0%; cement and concrete product manufacturing, +4.1%; machinery and equipment rental and leasing, +2.0%; real estate, +2.0%; building materials and supplies dealers, -1.2% (although housing starts are no longer free falling like last year); and oil and gas exploration and development, -2.8%.
Design services work at architectural and engineering firms is a nigh-on compulsory early-stage step in the entire building process that eventually leads to activity in the field. Consequently, the +5.0% y/y advance in the number of jobs in the sector is good news. Also offering optimism, the latest Architecture Billings Index from the American Institute of Architects and Deltek rose from 48.5 in April to 51.0 in May, the highest since last Fall. (Below 50.0, revenues for design firms are shrinking; above it, they’re expanding.) Another index from AIA/Deltek measures inquiries into new projects and it picked up m/m in May, moving to 57.2 from 53.9.
Graph 1: Change in Level of U.S. Construction Employment, Month to Month (M/M) − Total & by Categories - June 2023
Graph 2: U.S. Manufacturing Versus Construction Employment - June 2023 - Seasonally Adjusted Payroll Data
Graph 3: U.S. Unemployment Rates: All Jobs & Construction - June 2023 (Not Seasonally Adjusted)
Graph 4: U.S. Employment - June 2023 - % Change Y/Y (Seasonally Adjusted)
Graph 5: U.S. Total & Subsectors Y/Y Jobs Change - June 2023 (Seasonally Adjusted)
Graph 6: U.S. Manufacturing Construction Starts - ConstructConnect (12-Month Moving Averages)
The one-quarter (+25.5%) advance in the value of total nonresidential starts in June versus May (m/m) resulted from a plus one-third (+33.0%) bump in the heavy engineering/civil subcategory and nearly as substantial increases in institutional (+29.4%) and commercial (+26.9%) groundbreakings. Only industrial starts were left sitting on the bench (-5.4%) (see Table 1).
The +11.0% gain in total nonresidential starts in June 2023 versus June 2022 (y/y) was thanks to a big rise in engineering (+40.0%), a nice climb in institutional (+25.0%), and a small step forward by commercial (+5.2%). Industrial starts, though, fell by about half (-49.3%).
On a year-to-date basis through the first half of 2023, total nonresidential starts were ahead of 2022’s January-June comparable dollar volume figure by +4.6%. Setbacks in the industrial (-23.5%) and commercial (-10.3%) subcategories were overcome by a sizable climb in heavy engineering (+23.5%) and an okay, but not outstanding, uptick in institutional (+12.0%).
Usually, about a third of all nonresidential starts derive from just two subcategory type-of-structure designations, roads/highways and schools/colleges. Through the first six months of 2023, their shares of total have been 18.0% and 15.4%, respectively, adding to 33.4%.
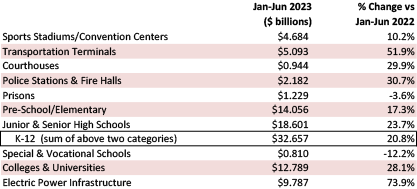
The three percentage-change metrics for street starts in June were +0.7% m/m, +21.2% y/y, and +19.5% YTD. For school starts, the results in the latest month were +25.7% m/m, +52.8% y/y, and +22.0% YTD. Delving deeper into educational facility starts, colleges and universities (+28.1% YTD) and junior and senior high schools (+23.7%) have done best (see Table 2).
Important beyond roads within the engineering subcategory are water/sewage and bridge starts. The results for the former in June were +3.2% m/m, +7.6% y/y, and +15.0% YTD. For the latter, they were negative across the board, -27.6% m/m, -30.5% y/y, and -7.5% YTD.
June’s three metrics for miscellaneous civil starts, a designation which includes electric power and railroad projects, were +471.9% m/m, +228.6% y/y, and +67.8% YTD. (See the power transmission, power generation, and tunnel projects among the Top 10.)
Important beyond schools within institutional work are three medical subcategories—i.e., hospitals/clinics, nursing/assisted living, and miscellaneous medical. Their combined starts in June were disappointing, at -49.0% m/m, -72.8% y/y, and -28.8% YTD. Hospital starts on their own in the latest month were likewise a shame: -56.9% m/m, -13.1% y/y, and -7.2% YTD.
Among commercial subcategories in June, amusement (+43.0%), government offices (+37.4%), and ‘miscellaneous’ (+28.6%) were up a lot, year to date. Within miscellaneous, transportation terminals were +51.9% YTD, and sports stadiums, +10.2%.
But many of the key categories were still down in a major way: warehouses, -33.2% YTD; retail/shopping, -19.1% YTD; and private office buildings, -38.8% YTD (although +237.3% m/m thanks to a data center in Loudoun County, Virginia, - see Top 10). The hotel/motel subcategory, while +2.4% YTD on top of a low base, was a nice-to-see +66.4% month-to-month.
Table 2: Construction Starts in Some Additional Type of Structure Subcategories
This Industry Snapshot sets out the history, from January 2005 to the present, of 12-month moving ConstructConnect starts averages for a dozen construction types of structures. The moving-average approach is designed to capture trends. (As a technical note, the moving average is graphed (i.e., placed) in the ending month.)
The mix between trend lines that are presently heading up versus those that are descending is a little more weighted towards the latter than the former, with institutional unique for progressing sideways. Clearly on upswings are heavy engineering, schools/colleges, roads/highways, water/sewage, and miscellaneous civil. Those on downswings are nonresidential buildings, commercial, private office buildings, retail, hospitals/clinics, and bridges.
Tables B-3 and B-8 of the monthly Employment Situation report from the BLS record average hourly and average weekly wages for industry sectors. B-3 is for all employees (i.e., including bosses) on nonfarm payrolls. B-8 is for production and nonsupervisory personnel only (i.e., it excludes bosses). For all jobs and construction, there are eight relevant percentage changes to follow.
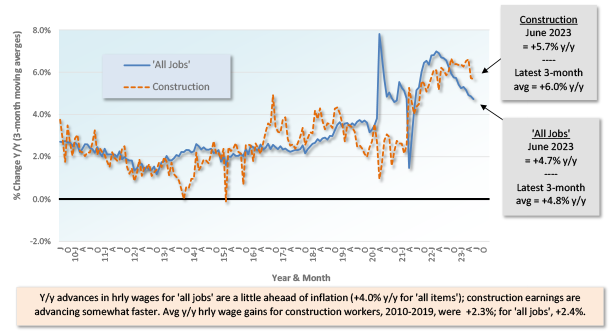
From June 2023’s Table B-3 (including bosses), y/y all-jobs earnings were +4.4% hourly and +3.7% weekly. Compensation hikes for construction workers, as a subset of all jobs, were better at +4.7% hourly and +5.5% weekly. From Table B-8 for production and nonsupervisory workers (i.e., excluding bosses), the y/y all-jobs paycheck advances were +4.7% hourly and +3.8% weekly. Once again, though, construction workers were able to revel in more bountiful stipend hikes with upticks of +5.7% y/y hourly and +6.5% y/y weekly.
June 2023’s CPI-U all items inflation number was +3.0% y/y (although the core rate, which omits volatile food and energy items, was still elevated at +4.8% y/y). Comparing wage gains to inflation suggests that purchasing power, a key ingredient in the consumer spending that drives gross domestic product, is no longer under the same severe strain as a year ago.
Graph 9: Average Hourly Earnings Y/Y - All Jobs & Construction
Graph 10: Average Weekly Earnings Y/Y - All Jobs & Construction
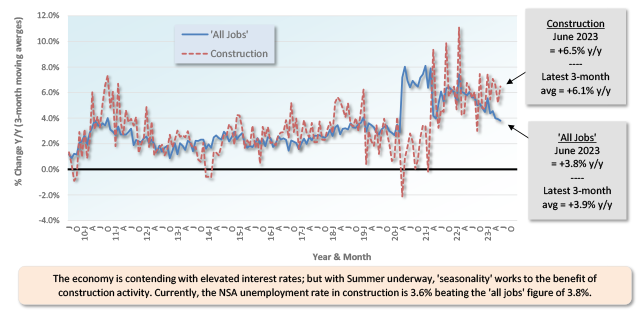
Table 3: 2023 YTD Ranking of Top 20 States by $ Volume of Nonresidential Construction Starts — ConstructConnect®
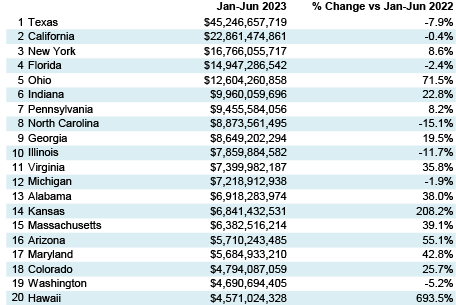
Table 4: 2023 YTD Ranking of Top 20 States by $ Volume of Nonresidential Building Construction Starts — ConstructConnect®
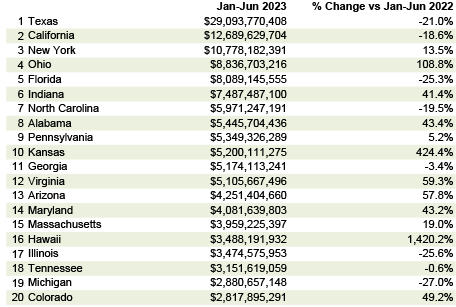
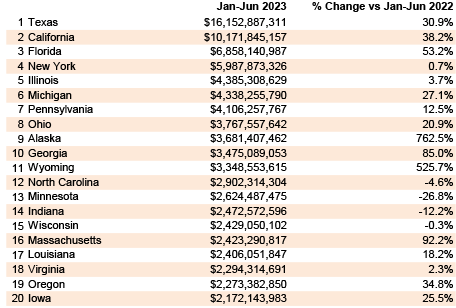
Table 5: 2023 YTD Ranking of Top 20 States by $ Volume of Heavy Engineering/Civil Construction Starts — ConstructConnect®
June 2023’s y/y results for three building related BLS Producer Price Index (PPI) series were: (A) construction materials special index, -3.4% (less negative than May’s -4.3%); (B) inputs to new construction index, excluding capital investment, labor, and imports, -4.8% (a minor pendulum swing back from the previous month’s -5.0%); and (C) final demand construction, designed to capture bid prices, +10.3% (not quite as aggressive as the prior period’s +10.9%).
(A) comes from a data series with a long history, but it’s confined to a limited number of major construction materials. (B) has a shorter history, but it’s more comprehensive in its coverage, although it includes some items (e.g., transportation) that aren’t strictly materials.
There are also PPI indices for specific construction inputs. There are only a few materials currently showing y/y price increases: cement, +13.3%; ready-mix concrete, +12.1%; and gypsum products, +2.5%. There are far more items with negative y/y price performances: number 2 diesel fuel, -49.2%; asphalt, -34.0%; softwood lumber, -20.8%; hot rolled steel bars, plates, and structural shapes, -10.8%; aluminum mill shapes, -10.7%; and copper wire and cable, -7.3%. Also, there’s an inputs to highways and streets index, -3.8%. Unleaded gasoline in the PPI data series is -37.2% y/y; as a subset in the Consumer Price Index (CPI), it’s -26.5% y/y.
The value of construction starts each month is derived from ConstructConnect’s database of all active construction projects in the U.S. ConstructConnect’s nonresidential construction starts series because it is comprised of total-value estimates for individual projects, some of which are super-large, has a history of being more volatile than many other leading indicators for the economy.
From Table 6(and also from Table 9) of this report, ConstructConnect’s total residential starts in June 2023 were -13.6% m/m, -35.1% y/y, and -27.4% YTD. Multi-family starts were -16.8% m/m, -57.6% y/y, and -31.0% YTD. Completing the picture, single-family starts were -12.4 m/m, -19.1% y/y, and -25.5% YTD.
Including home building with all nonresidential categories, Grand Total starts in June 2023 were +11.6% m/m, -7.1% y/y, and -8.5% YTD.
ConstructConnect adopts a research-assigned start date. In concept, a start is equivalent to ground being broken for a project to proceed. If work is abandoned or rebid, the start date is revised to reflect the new information.
One way to measure just how hard the Federal Reserve is hitting the brakes on the economy in an effort to tame inflation is by monitoring how quickly it is shrinking the supply of dollars. Between 1960 and 2021, the Federal Reserve rarely shrank the supply of money. Three acute instances of such behavior occurred in 1970, 1975, and again in 1980. During those years, inflation rates neared 7%, 12%, and 14%, respectively, and each time the Fed shrank the money supply by -5% to -6%. In every instance, a recession ensued.
Beginning in early 2022, the Fed once again began contracting the pool of dollars. By April 2023, the supply of dollars had contracted by a record-setting -9.1%. Despite the Fed's unprecedented efforts, core inflation remains near 5% and the latest wage data indicates a 5.7% annualized rise. Most importantly, no obvious recession is in sight. Such an unusual combination of factors may highlight the core challenge facing the Fed. There’s a structural tightness in the labor market due to decades of falling birthrates, lower employment participation, and a COVID-accelerated decline in the number of workers over the age of 55 still in the workforce.
Should one accept that labor shortage is the greatest restraint to future economic growth, is monetary policy even the right tool to guide the economy? Or should the country be using other tools or policies? At the start of 2023, the Congressional Budget Office projected that the population of prime-age people 25-54 years old will grow on average by 0.2% annually over the next 30 years. That is less than one-quarter of the growth rate of the past 40 years. A native-born prime-age workforce contraction will result in all labor growth occurring due to immigration.
The implication for industry leaders is that while near-term economic pain may vanquish the present inflation problem, monetary policy may not be an efficient nor particularly effective tool for addressing the nation’s long-run labor shortage. Having a business strategy that, at its core, prioritizes long-run labor retainment and growth could be the essential difference between the firm that is able to grow in the coming years and the one that is forced to decline work for lack of staffing, as was acutely felt during COVID-19. It may not be until the next recession, however, that we will know which companies have the resolve to honor this simple principle. - Michael Guckes, Senior Economist
A rule of thumb is that nonresidential construction is a lagging indicator among economic measures. Companies are hesitant to undertake capital spending until their personnel needs are rapidly expanding and their office square footage or plant footprints are straining capacity. Plus, it helps if profits are abundant.
The rule doesn’t always hold true, however. For example, under present circumstances, weakness in some (mainly cyclical) areas of construction investment may well be offset by rich veins of large industrial and engineering projects.
Each month, ConstructConnect publishes information on upcoming construction projects at its Expansion Index.
The Expansion Index, for hundreds of cities in the United States and Canada, calculates the ratio, based on dollar volume, of projects in the planning stage, at present, divided by the comparable figure a year ago. The ratio moves above 1.0 when there is currently a larger dollar volume of construction prospects than there was last year at the same time. The ratio sinks below 1.0 when the opposite is the case. The results are set out in interactive maps for both countries.
Click here to download the Construction Industry Snapshot Package - July 2023 PDF.
Click here for the Top 10 Project Starts in the U.S. - June 2023.
Click here for the Nonresidential Construction Starts Trend Graphs - June 2023.
ConstructConnect announced today that January 2023’s volume of nonresidential construction starts was $57.0 billion versus December’s $50.0 billion.
ConstructConnect's May 2023 volume of nonresidential construction starts was $49.2 billion, up +4.3% versus April 2023’s figure of $47.1 billion
ConstructConnect announced today that December 2022’s volume of nonresidential construction starts was $50.1 billion, +58.1% compared with November’s...
ConstructConnect's March 2023 volume of nonresidential construction starts was $47.6 billion, an increase of +45.0% versus February 2023.