December's Nonresidential Construction Starts +58% M/M, +78% Y/Y, & +33% YTD
ConstructConnect announced today that December 2022’s volume of nonresidential construction starts was $50.1 billion, +58.1% compared with November’s...

ConstructConnect announced today that January 2023’s volume of construction starts, excluding residential work, was $57.0 billion, an increase of +13.9% compared with December’s figure of $50.0 billion (originally reported as $50.1 billion). January was another month with an extraordinary wealth of mega-sized project initiations (i.e., projects carrying estimated values of a billion dollars or more each.) More on this in a moment.
Total nonresidential starts in January 2023 were +67.3% versus their level in January 2022. Nonresidential building starts were nearly double their figure in the first month of last year. Usually, here’s where I report on year-to-date results, but January is a unique month. January’s standalone and year-to-date results are one and the same thing. There’s not much point in reporting year-to-date percentage changes when they’re no different from year-over-year.
Click here to download the complete Construction Industry Snapshot Package - January PDF.
In January, there were three mega-sized project groundbreakings summing to $14.6 billion. By far, the largest was $10.5 billion for a Sempra Energy LNG facility in Texas. But also significant were an aluminum recycling and rolling plant for Novelis in Alabama, $2.5 billion, and a new hospital in Indiana, $2.5 billion. Another hospital project in California, valued at $975 million, just missed qualifying as a megaproject.
Somewhat surprisingly, there were few major hospital project groundbreakings during the pandemic. Standard sources of revenue generation were shunted aside by the care concentrated in one area, COVID-19 infection mitigation. But hospital construction appears to be roaring back.
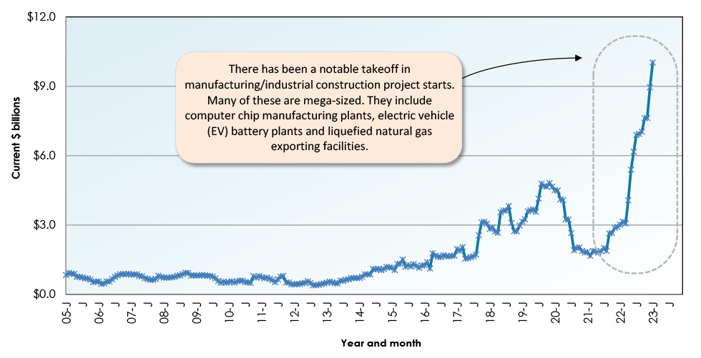
Thanks to the big LNG and aluminum projects, manufacturing/industrial construction starts in January of this year were +440% compared with January of last year. The remarkable flow of megaprojects last year didn’t really begin until April 2022, when almost immediately it became a flood. Interestingly, the two manufacturing megaprojects in January of this year, adding to $13.0 billion, didn’t meet the $14.9 billion of similar work from three projects in December of last year, explaining manufacturing’s -9.2% percentage change month over month.
The abundance of megaprojects is a story that’s compelling for several years. The types of such projects that are being given the go-ahead (e.g., EV battery plants, computer chipmaking plants, LNG facilities, carbon capture, and storage sites) say much about the shifts underway in the broad economy. There are also job market implications. Work on these projects is almost always higher paying and more stable. And winning contractors can be tied up, in a good way, for years.
To complete the overview picture, the grand total dollar volume (i.e., adding residential to nonresidential activity) of starts in January 2023 was +10.3% m/m and +24.8% y/y.
Other statistics often beloved by analysts are trailing twelve-month results and these are set out for all the various type-of-structure categories in Table 9.
Grand Total TTM starts in January, on a month-to-month basis, were the same as in December, +1.7%. Those upward blips were better than November’s -1.3%.
On a year-over-year basis, Grand Total TTM starts showed a positive progression that went from +17.1% in November to +18.1% in December and +18.8% in January.
Starts compile the total estimated dollar value and square footage of all projects on which ground is broken in any given month. They lead, by nine months to as much as two years, put-in-place statistics, which are analogous to work-in-progress payments as the building of structures proceeds to completion.
PIP numbers cover the universe of construction, new plus all manner of renovation activity, with residential traditionally (i.e., over the decade preceding the pandemic) making up two-fifths (about 40%) of the total, and nonresidential, three-fifths (i.e., the bigger portion, at around 60%).
During the past several years, however, there’s been a dramatic change in the proportional shares of the total put-in-place dollar volume taken by residential versus nonresidential. In 2021’s full-year PIP results, the relationship was about half and half, with residential at 49.4% and nonresidential, 50.6%. Still, it was nonresidential managing to eke out an advantage.
The breakthrough for residential finally came in 2022. For the year as a whole, and for the first time in a long while (maybe ever), its share of the total exceeded more than half, 50.7% to 49.4% for nonresidential. This pattern is not expected to hold in 2023. Among type-of-construction categories, the move to a higher interest rate regime is negatively impacting the housing market before all others. The permits data is already leading housing starts on a downward journey.
The reported PIP numbers from the Census Bureau are always a month behind starts data. Therefore, we’re now looking at 2022 year-end PIP results. The total dollar volume was +10.2% compared with full-year 2021. Residential was +13.1% compared with nonresidential’s +7.4%. But the latter had some subcategories with impressive showings. Manufacturing PIP construction was +34.8%. Commercial (retail and warehouses) was +21.4%. Water supply and treatment approached +20%. Health care and roads almost achieved double-digit percent gains.
PIP numbers, being more spread out, have smaller peak-over-trough percent-change amplitudes than the starts series. As an additional valuable service for clients and powered by its extensive starts database, ConstructConnect, in partnership with Oxford Economics, a world leader in econometric modeling, has developed put-in-place construction statistics by types of structure for U.S. states, cities, and counties, actuals and forecasts. ConstructConnect’s PIP numbers are released quarterly and are featured in a separate reporting system.
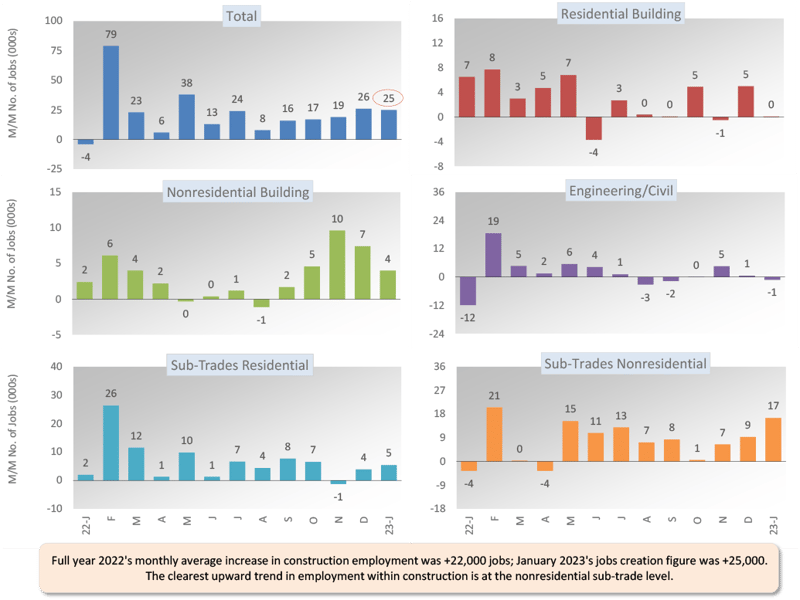
Construction’s share of U.S. total non-farm employment in the monthly labor market report issued by the Bureau of Labor Statistics (BLS) is slightly more than 5.0%. Accordingly, to claim its share of January’s +517,000 economy-wide number-of-jobs advance, the figure for construction would have been +26,000. And that’s almost exactly what it was, +25,000 jobs. Throughout 2022, the monthly average climb in construction employment was +12,000 jobs.
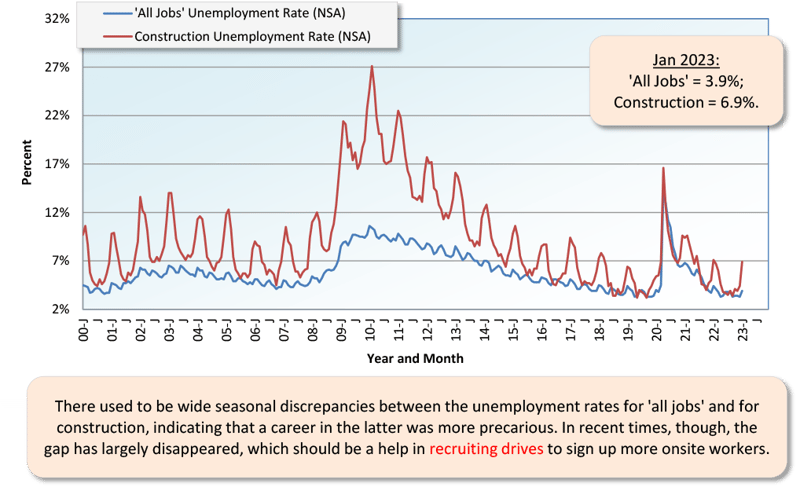
Construction’s not seasonally adjusted unemployment rate in January was 6.9%, up from December’s 4.4%. A jump of that magnitude is not unexpected at this time of year, due to an effect known as seasonality. Cold winter weather takes a bite out of outdoor on-site activity.
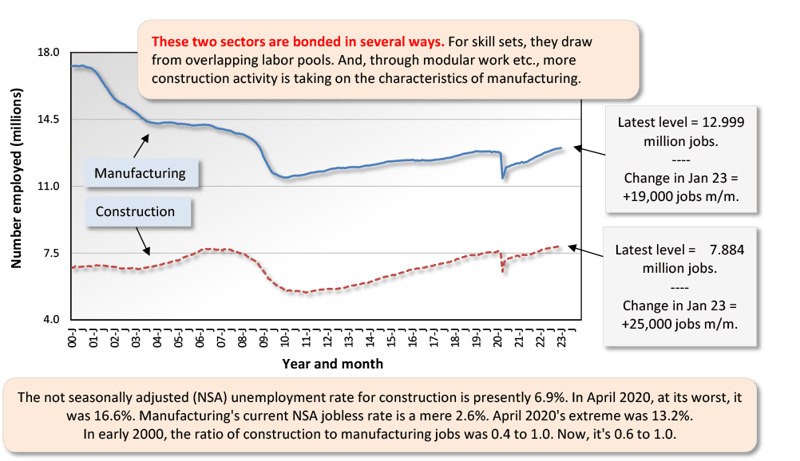
December’s NSA U rate for construction of 6.9% was higher than the nation’s ‘all jobs’ figure of 3.9%. It was also above manufacturing 2.6%. Both the manufacturing and construction sectors are in the goods-producing segment of the economy (i.e., as opposed to services-producing), and there is considerable overlap between their labor pools. As an interesting aside, the NSA U rate for mining, quarrying, and oil and gas extraction in January was a barely-there 0.3%.
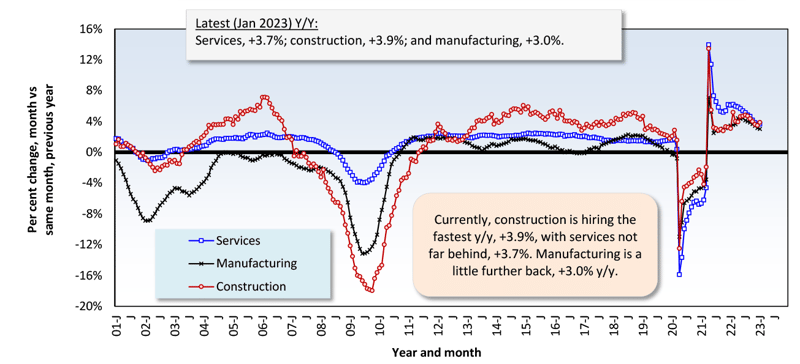
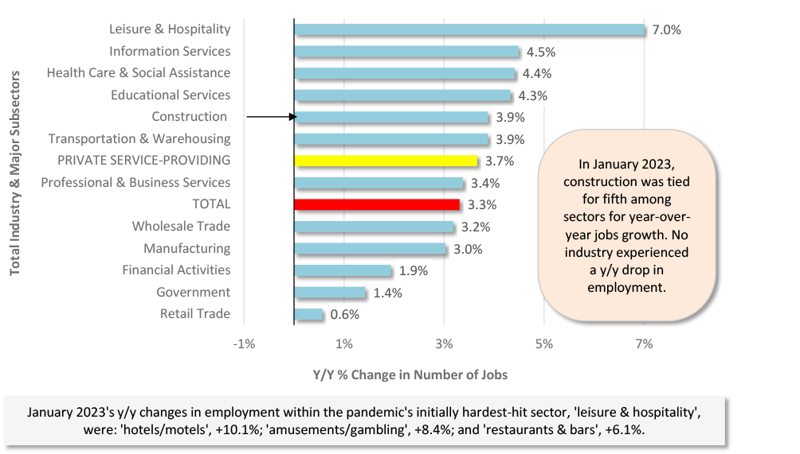
In January, U.S. construction pulled off a faster rate of year-over-year jobs growth, at +3.9%, than the economy as a whole, +3.3%; manufacturing, +3.0%; and total services-providing firms, +3.7%. The leader among industries, though, was leisure and hospitality, +7.0%.
In other segments of the economy with close ties to construction, January 2023’s percentage changes in employment were as follows: oil and gas exploration and development, +6.8%; machinery and equipment rental and leasing, +5.5%; architectural and engineering design services, +4.8%; cement and concrete product manufacturing, +4.0%; real estate, +3.8%; and building materials and supplies dealers, -0.6%.
Since design services work at architectural and engineering firms leads naturally to construction activity in the field, it’s good to see a +4.8% gain in job growth. But the Architecture Billings Index from the American Institute of Architects is not as encouraging. The ABI figure in December was 47.5. A number below 50.0 indicates shrinking opportunities for design firms. But it should also be noted that December’s ABI was an uptick from November’s 46.0.
Graph 1: Change in Level of U.S. Construction Employment, Month to Month (M/M) − Total & by Categories - January 2023
Graph 2: U.S. Manufacturing Versus Construction Employment - January 2023 - Seasonally Adjusted Payroll Data
Graph 3: U.S. Unemployment Rates: All Jobs & Construction - January 2023 (Not Seasonally Adjusted)
Graph 4: U.S. Employment - January 2023 - % Change Y/Y (Seasonally Adjusted)
Graph 5: U.S. Total & Subsectors Y/Y Jobs Change - January 2023 (Seasonally Adjusted)
Graph 6: U.S. Manufacturing Construction Starts - ConstructConnect (12-Month Moving Averages)
The +13.9% month-to-month (m/m) bump in January’s total nonresidential starts arose mainly because the institutional dollar figure was one-half higher than in December (+52.1%). Also helping to almost equal degrees, among subcategories, were engineering (+15.8%) and commercial (+15.7%). The only major grouping with a retreating performance month to month was industrial (-9.2%), and that’s only because a massive volume of megaproject work this January wasn’t a match for an even bigger volume in January 2022.
The two-thirds (+67.3%) pickup in the total dollar volume of nonresidential starts in January 2023 versus January 2022 (y/y) originated largely in industrial (+439.9%), with institutional (+80.6%) being impressive as well. Nor should engineering (+31.2%) be slighted or overlooked. That leaves commercial (-10.3%), which was on its own in failing to move forward.
This is where I usually mention in the monthly report that there are two dominant subcategories of total nonresidential starts, roads/highways and schools/colleges. In January, their shares were 15.9% and 11.6%, respectively, adding to 27.5% of the nonresidential total. But another player has entered the limelight. Attention should also be paid to the fact that on its own, the industrial/manufacturing subcategory was an even greater 27.7% of January’s nonresidential total.
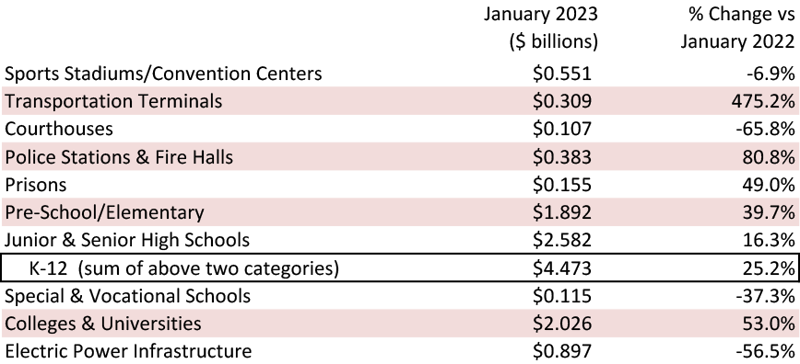
The two percentage-change metrics for street starts in January 2023 were +132.7% m/m and +66.7% y/y. For educational facility starts, the results were +19.6% m/m and +30.1% y/y. At a micro level in education, K-12 starts were +25.2% y/y, and colleges/universities, +53.0% y/y.
Important beyond roads within the engineering subcategory are water/sewage and ‘bridge’ starts. The results for the former in January were +7.2% m/m and +25.4% y/y. For the latter, they were +52.2% m/m and +17.2% y/y. Miscellaneous civil starts, however, which include a power generation component, were a disappointing -64.0% m/m and -23.0% y/y.
Important beyond schools in institutional are three medical subcategories, i.e., hospitals/clinics, nursing/assisted living, and miscellaneous medical. Their combined starts in January 2023 were +94.9% m/m and +183.7% y/y. Hospital/clinic starts on their own set a blazing pace, +125.2% m/m and +573.0 y/y.
The military subcategory, while recording a relatively low dollar volume in January, did put forth two eye-catching percentage-change metrics, +446.5% m/m and +1180.0% y/y.
Next to residential, the category of construction perhaps most likely to be negatively impacted by the financial strictures embodied in higher interest rates is commercial. Five of commercial’s subcategories in January recorded double-digit percentage-change declines, year over year. The three standouts for making progress despite formidable headwinds, were amusement (+102.5% y/y), government offices (+52.9%), and laboratories (+179.6%).
Table 2: Construction Starts in Some Additional Type of Structure Subcategories
This Industry Snapshot sets out the history, from January 2005 to the present, of 12-month moving ConstructConnect starts averages for a dozen construction types of structures. The moving-average approach is designed to capture trends. (As a technical note, the moving average is graphed at the ending month.)
Almost all the graphs, in their recent-month phases, are trending upwards. Commercial is an exception, though, as it’s moving sideways, and that’s because two of its key components, private office buildings and retail, are stuck on flat planes, with rebounds proving elusive.
Tables B-3 and B-8 of the monthly Employment Situation report, from the BLS, record average hourly and average weekly wages for industry sectors. B-3 is for all employees (i.e., including bosses) on nonfarm payrolls. B-8 is for production and nonsupervisory personnel only (i.e., it excludes bosses). For all jobs and construction, there are eight relevant percentage changes to follow.
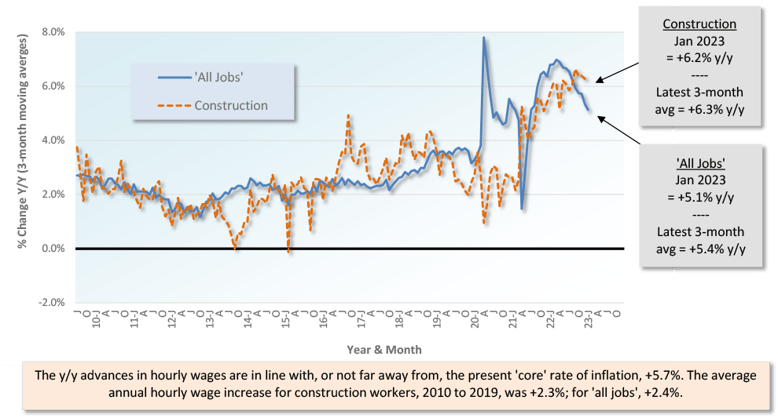
From January 2023’s Table B-3 (including bosses), y/y all-jobs earnings were +4.4% hourly and +4.7% weekly. Construction workers, as a subset of all jobs, did better, +5.5% hourly and +6.9% weekly. From Table B-8 for production and non-supervisory workers (i.e., excluding bosses), the y/y all-jobs paycheck advances were +5.1% hourly and +5.4% weekly. In this instance, construction workers had an even bigger advantage, +6.2% hourly and +7.2% weekly.
Graph 9: Average Hourly Earnings Y/Y - All Jobs & Construction
Graph 10: Average Weekly Earnings Y/Y - All Jobs & Construction
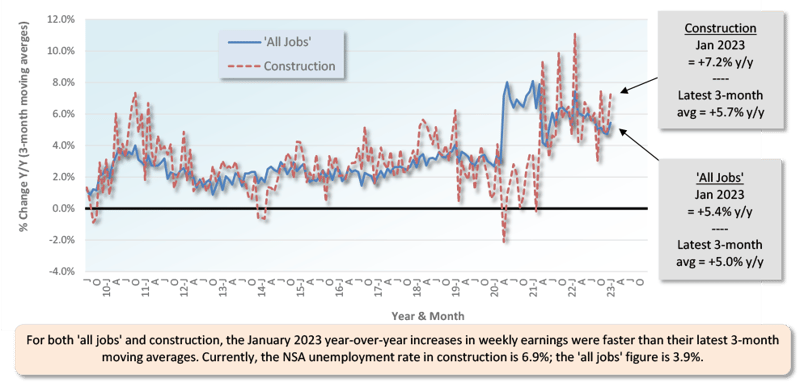
Table 3: 2022 YTD Ranking of Top 20 States by $ Volume of Nonresidential Construction Starts — ConstructConnect®
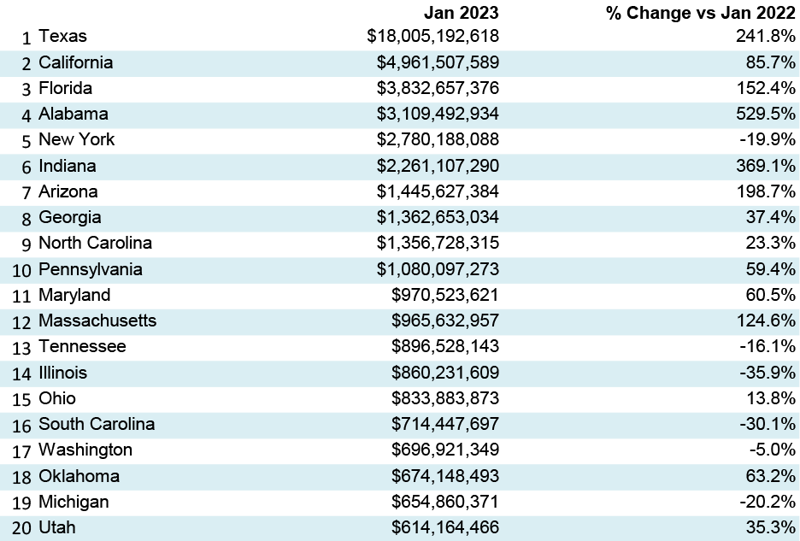
Table 4: 2022 YTD Ranking of Top 20 States by $ Volume of Nonresidential Building Construction Starts — ConstructConnect®
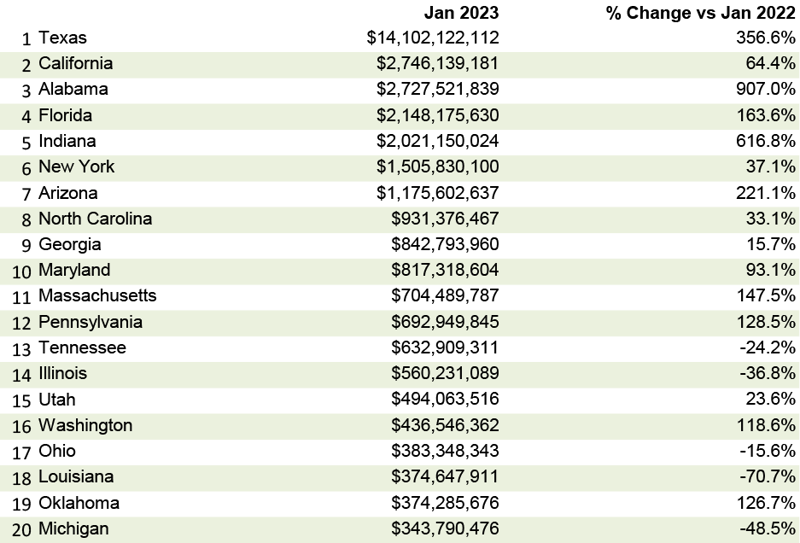
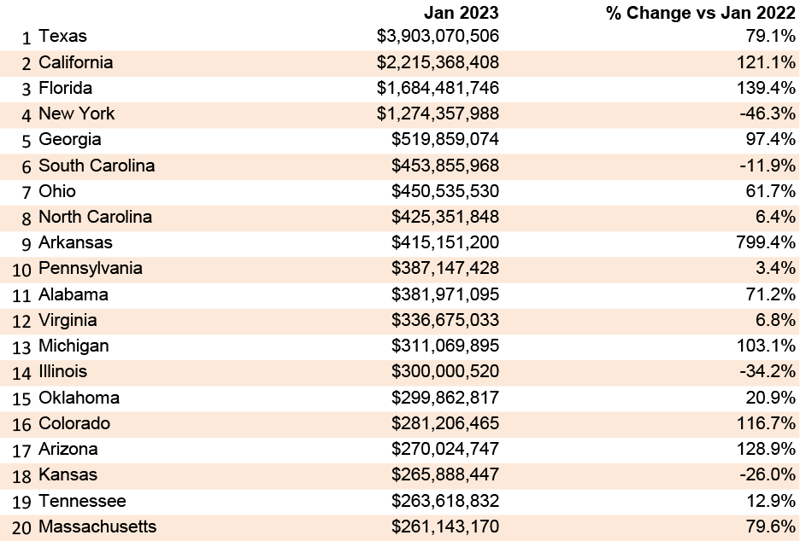
Table 5: 2022 YTD Ranking of Top 20 States by $ Volume of Heavy Engineering/Civil Construction Starts — ConstructConnect®
This 2022 yearend Industry Snapshot is being written ahead of when December construction material cost information, as captured by the Producer Price Index data set, will be released (Jan 18, 2023). Therefore, the following paragraph is a repeat from a month ago.
January 2023’s y/y results for three building-related BLS Producer Price Index series were: (A) construction materials special index, -5.7% (a further decline from December’s -2.6%); (B) inputs to new construction index, excluding capital investment, labor, and imports, +3.0% (a moderation from the previous month’s +6.1%); and (C) final demand construction, designed to capture bid prices, +16.6% (coming down from +18.5% in the period prior).
(A) comes from a data series with a long history, but it’s confined to a limited number of major construction materials. (B) has a shorter history, but it’s more comprehensive in its coverage, although it includes some items (e.g., transportation) that aren’t strictly materials.
There are also PPI indices for specific construction inputs. Most of the year-over-year changes now are nothing like as shocking as they were not so long ago. In fact, the dominant tendency has been for considerable moderation. Continuing to show y/y increases are: diesel fuel, +22.8%; cement, +17.6%; ready-mix concrete, +12.9%; and gypsum products, +10.7%. But items with their costs altering to the downside include copper wire and cable, -3.4%; aluminum mill shapes, -6.1%; hot rolled steel bars, plates, and structural shapes, -7.1%; asphalt, -7.2%; and softwood lumber, -44.1%. Also, there’s an inputs to highways and streets index, +4.9% y/y.
The value of construction starts each month is derived from ConstructConnect’s database of all active construction projects in the United States. ConstructConnect’s nonresidential construction starts series, because it is comprised of total-value estimates for individual projects, some of which are super-large, has a history of being more volatile than many other leading indicators for the economy.
ConstructConnect’s total residential starts in January 2023 were +1.7% m/m, but -25.7% y/y. Multi-family starts were +21.3% m/m, but -20.3% y/y. Single-family starts were -7.4% m/m and -28.6% y/y.
Including home building with all nonresidential categories, grand total starts in January 2023 were +10.3% m/m and +24.8% y/y.
ConstructConnect adopts a research-assigned start date. In concept, a start is equivalent to ground being broken for a project to proceed. If work is abandoned or rebid, the start date is revised to reflect the new information.
Broad measures of the economy through mid-February continue to signal that consumer and business conditions overall are doing better than were expected just months ago when many were questioning just what kind of recession to expect in 2023. However, broad measures of economic performance can easily hide the strength or weakness of specific sectors, including construction.
For this reason, ConstructConnect strives to build, maintain, and analyze a wide range of proprietary construction databases. The latest addition to this repository is the Project Stress Index, or PSI, which tracks changes in the level of projects that are delayed, placed on hold, or abandoned. While all resources in the ConstructConnect library are construction focused, this one is unique in that it uses weekly construction activity data.
Through the first seven weeks of 2023, the levels of projects delayed, put on hold, or abandoned have not changed significantly from a year ago. This comes despite higher borrowing costs and stiffer loan standards for commercial real estate developers over the last 12 months, according to data collected by the Bank of America and the Senior Loan Officer Opinion Survey produced by the Federal Reserve.
When comparing recent readings to even more distant results, the latest project stress figures remain above the levels recorded in 2020 and 2021, potentially suggesting that the conditions for bringing projects from idea to full completion remain more difficult now than they were two and three years ago. However, to the degree that 2022 was a good year for the industry, a repeat would not be the worst thing that could happen. - Michael Guckes, Senior Economist
A rule of thumb is that nonresidential construction is a lagging indicator among economic measures. Companies are hesitant to undertake capital spending until their personnel needs are rapidly expanding and their office square footage or plant footprints are straining capacity. Plus, it helps if profits are abundant.
The rule doesn’t always hold true, however. For example, under present circumstances, weakness in some (mainly cyclical) areas of construction investment may well be offset by rich veins of large industrial and engineering projects to be unearthed.
Each month, ConstructConnect publishes information on upcoming construction projects at its Expansion Index.
The Expansion Index, for hundreds of cities in the United States and Canada, calculates the ratio, based on dollar volume, of projects in the planning stage, at present, divided by the comparable figure a year ago. The ratio moves above 1.0 when there is currently a larger dollar volume of construction prospects than there was last year at the same time. The ratio sinks below 1.0 when the opposite is the case. The results are set out in interactive maps for both countries.
Click here to download the Construction Industry Snapshot Package - January 2022 PDF.
Click here for the Top 10 Project Starts in the U.S. - January.
Click here for the Nonresidential Construction Starts Trend Graphs - January 2023.
ConstructConnect announced today that December 2022’s volume of nonresidential construction starts was $50.1 billion, +58.1% compared with November’s...
ConstructConnect announced June 2023’s volume of nonresidential construction starts was $63.2 billion, up +25.5% versus May 2023’s $50.3 billion.
ConstructConnect announced today that July's volume of construction starts, excluding residential work, was $53.7 billion.
ConstructConnect's May 2023 volume of nonresidential construction starts was $49.2 billion, up +4.3% versus April 2023’s figure of $47.1 billion