September's Nonresidential Construction Starts +26% M/M, +19% Y/Y, & +29% YTD
ConstructConnect announced today that July's volume of construction starts, excluding residential work, was $53.7 billion.

ConstructConnect announced today that July 2022’s volume of construction starts, excluding residential work, was $53.7 billion, an increase of +12.2% compared with June’s figure of $47.9 billion (originally reported as $47.5 billion).
As has occurred consistently over the last several months, the latest period’s results were given a big boost by megaprojects. Such undertakings carry an estimated value of a billion dollars or more each. Half of July’s top 10 groundbreakings were of such a nature (see Table 8).
/industry-snapshot_august_2022.jpg?width=200&name=industry-snapshot_august_2022.jpg)
View this information as an infographic.
Click here to download the complete Construction Industry Snapshot Package - July 2022 PDF.
The first quarter of this year had only one megaproject, for $2.0 billion. Then at the beginning of Q2, the trickle became a torrent. In April, there were five megaprojects with a total estimated value of $17.1 billion. May featured four mega projects for $20.0 billion. June was somewhat quieter, serving up three ultra-large projects for $7.8 billion. Then July came storming back with five megaprojects adding up to $13.3 billion. The largest of the five was a General Motors battery cell manufacturing plant in Lansing, Michigan, for $7.0 billion.
July 2022’s total dollar volume of nonresidential construction starts was ahead by one-third, +32.3%, when compared with July 2021. On a year-to-date basis, total nonresidential starts have been +29.4% versus January to July of last year.
To complete the starts picture, the GRAND TOTAL (i.e., adding residential to nonresidential activity) in July 2022 was +12.0% m/m, +16.8% y/y, and +15.7% YTD.
There are three major subcategories of total starts: residential, nonresidential building, and heavy engineering/civil. On a year-to-date percentage-change basis in July 2022, nonresidential building starts performed best, +37.1%, with engineering also nicely ahead, +18.1%. Residential was left spinning its wheels, -0.1%.
On a month-to-month basis, nonresidential building was out front as well, +24.3%, but it was residential in second place, +11.5%. The engineering category of starts faltered, -7.5%.
Other statistics often beloved by analysts are trailing twelve-month results and these are set out for all the various type-of-structure categories in Table 10.
Grand Total TTM starts in July 2022 on a month-to-month basis were +1.5%, a slight pickup from June’s stand pat pace of 0.0%, but a slowing versus May’s +3.1%.
On a year-over-year basis in July 2022, GT TTM starts were +13.5%, the same as in June (also +13.5%), but a little behind May’s +15.0%.
Starts compile the total estimated dollar value and square footage of all projects on which ground is broken in any given month. They lead, by nine months to as much as two years, put-in-place statistics which are analogous to work-in-progress payments as the building of structures proceeds to completion.
PIP numbers cover the universe of construction, new plus all manner of renovation activity, with residential traditionally making up two-fifths (about 40%) of the total and nonresidential, three-fifths (i.e., the bigger portion, at around 60%).
Over the past several years, however, the mix has undergone a massive and startling shift. In 2021’s full-year PIP results, the residential to nonresidential relationship was about half and half. Through June of this present year, 2022, the ratio, on a not seasonally adjusted basis, has swung even more in favor of the former, with residential at 53.0% and nonresidential at 47.0%.
The January-June 2022 over January-June 2021 total dollar volume of PIP construction was +10.7%, with residential at +20.8% and nonresidential at a barely advancing +1.2%. As the second half of 2022 proceeds and the months tick by, the big disparity in gains will almost certainly narrow. Residential construction activity is notoriously susceptible to shrinkage under a climbing interest rate regime. (Conversely, it receives a big boost when mortgage rates are declining.)
PIP numbers, being more spread out, have smaller peak-over-trough percent-change amplitudes than the starts series. As an additional valuable service for clients and powered by its extensive starts database, ConstructConnect, in partnership with Oxford Economics, a world leader in econometric modeling, has developed put-in-place construction statistics by types of structure for U.S. states, cities and counties, actuals, and forecasts. ConstructConnect’s PIP numbers are being released quarterly and are featured in a separate report.
Construction’s share of U.S. total nonfarm employment in the monthly Employment Situation report is slightly more than 5.0%. To claim its proportional share of July’s economywide number of jobs increase of +528,000, the figure for construction would have been +27,000. Instead, it was higher at +32,000. The year-to-date monthly average of construction employment is now +23,000 jobs versus +5,000 in June-July 2021. In July 2022, residential (+11,000) and nonresidential (+10,000) subcontractors accounted for most of the month-to-month climb in the total construction jobs count.
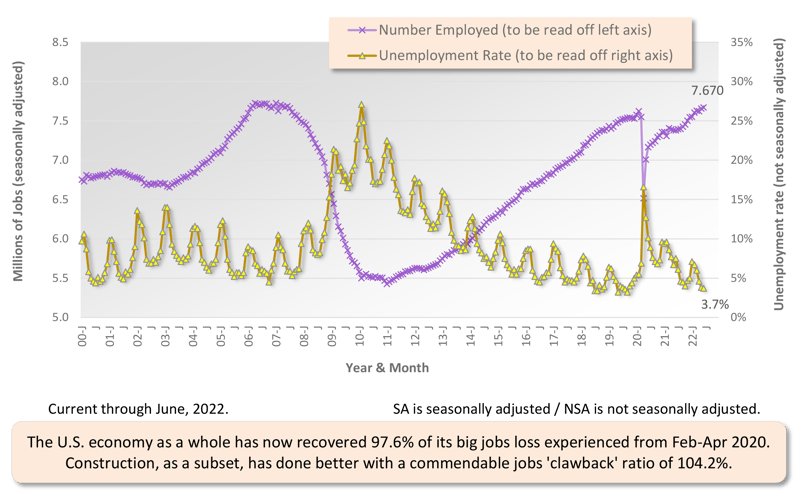
Construction doesn’t usually record a not seasonally adjusted unemployment rate that is lower than for all jobs. Lately, though, the exception has been the rule. Construction’s NSA U rate in July was 3.5%, comparing favorably with the all jobs NSA U rate of 3.8%. The 3.5% figure for construction in July was an improvement on June’s 3.7% and was less than half July 2021’s level of 7.5%.
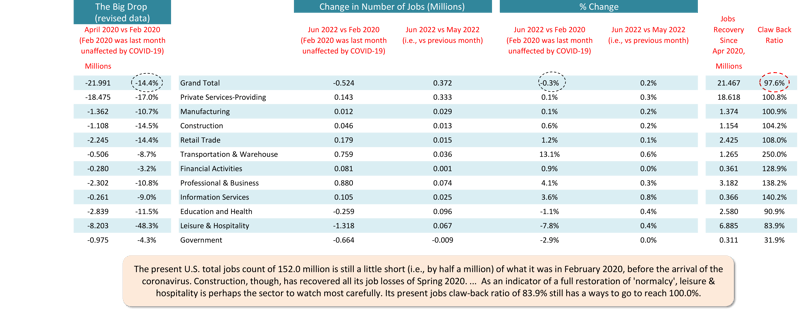
July’s Employment Situation report marked a watershed moment for the U.S. overall economy. The total number of jobs finally returned to their perch from before the pandemic. The huge nosedive in positions that occurred between February and April 2020 has now been fully reversed. The jobs claw-back ratio is 100.1%; for construction, it’s 107.4%.
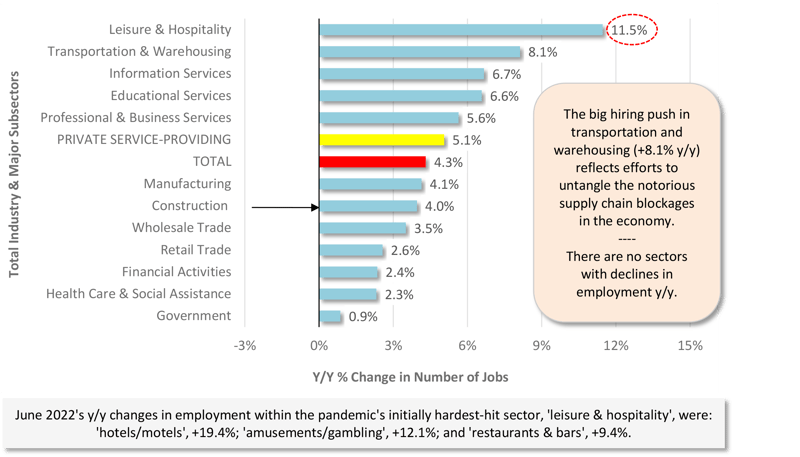
Interestingly, July’s year-over-year gain in construction employment, at +4.2%, was the same as for all jobs, also +4.2%. The sector hardest hit by the stay-at-home guidelines of the past couple of years, leisure and hospitality, has seen its employment surge +10.7% y/y.
In other segments of the economy with close ties to construction, the latest y/y percentage changes in employment have been as follows: oil and gas exploration and development, +21.3%; machinery and equipment rental and leasing, +8.1%; architectural and engineering design services, +6.3%; real estate, +3.1%; cement and concrete product manufacturing, +2.9%; and building materials and supplies dealers, -4.0%. Only the last number points to a disappointing retreat in employment.
Design services work leads into later on-site activity. Therefore, the +6.3% increase for design services jobs is a positive read on the prospects for future hardhat employment. Furthermore, the latest (June 2022) Architecture Billings Index from the American Institute of Architects, which provides a gauge of the demand for construction design services, stayed healthy at 53.2 (versus 53.5 in May, so slightly less upbeat), above the 50.0 benchmark figure that separates more sales from less, month to month.
Graph 1: Change in Level of U.S. Construction Employment, Month to Month (M/M) −
Total & by Categories - July 2022
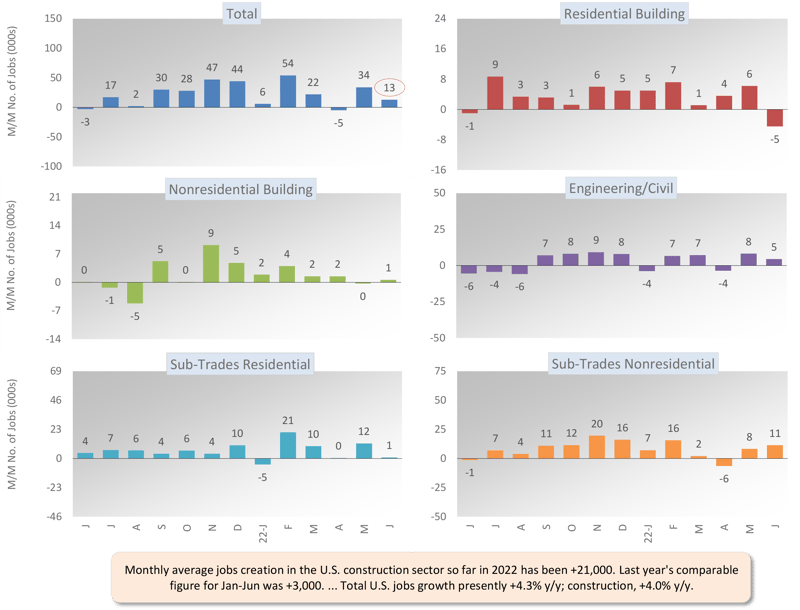
Table 2: Monitoring the U.S. Employment Recovery - July 2022
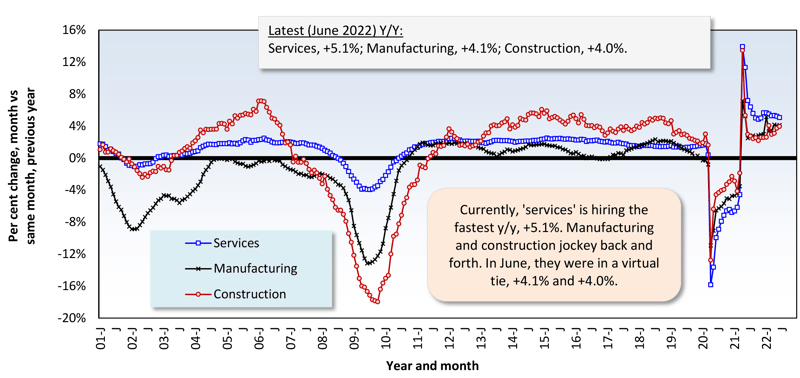
Graph 2: U.S. Employment May 2022 - % Change Y/Y
Based on Seasonally Adjusted (SA) Data
Graph 3: Y/Y Jobs Change, U.S. Total Industry & Major Subsectors — July 2022 (Based on Seasonally Adjusted Payroll Data)
Graph 4: U.S. Construction Employment (SA) & Unemployment Rate (NSA)
July 2022’s total nonresidential starts bump of +12.2% month-to-month (m/m) was led by institutional (+40.4%), with commercial (+19.7%) and industrial (+11.6%) also lending helping hands. Only heavy engineering/civil was reluctant to move forward (-7.5%).
The plus one-third (+32.3%) leap in total nonresidential starts, July of this year versus July of last year (y/y), originated primarily with industrial (+311.9%) and institutional (+64.5%), as commercial dawdled (+2.4%) and engineering took a step back (-8.2%).
As for July’s year-to-date gain of +29.4% for total nonresidential starts, it owed much to industrial (+320.0%), although engineering (+18.1%) and institutional (+10.4%) also assisted significantly. Commercial played only a small positive role (+5.5%).
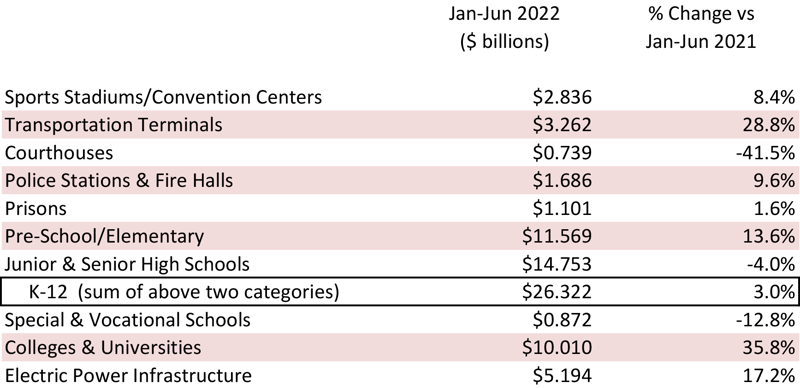
There are two dominant subcategories of total nonresidential starts. When the volumes of roads/highways and schools/colleges are added together, they account for 30.9% of July’s total nonresidential starts YTD (i.e., shares of 16.8% and 14.1% respectively).
The three percentage-change metrics for street starts in July 2022 were -7.8% m/m and -6.6% y/y, but +23.3% YTD. Educational facility starts were more upbeat: +11.5% m/m; +61.5% y/y; and +14.5% YTD. The improvement in school starts is being driven primarily by colleges and universities, +27.3% YTD, and preschool and elementary structures, +20.3% YTD.
Important beyond roads within the engineering subcategory are water/sewage and bridge starts. The former in July was -2.4% m/m, but +19.6% y/y and +22.1% YTD; the latter was -22.5% m/m, but +28.8% y/y and +43.8% YTD.
Important beyond schools in institutional are three medical subcategories, i.e., hospitals/clinics, ‘nursing/assisted living, and miscellaneous medical. Their combined starts in July 2022 were +136.7% m/m; +102.2% y/y; and +6.4% YTD. Hospital/clinic groundbreakings on their own were +22.8% YTD. (A $1.2 billion hospital project in Pittsburgh was initiated in July.)
Among commercial starts in July, notable year-to-date increases have been recorded by miscellaneous, +35.7%, and laboratories, +47.4%. Miscellaneous includes transportation terminal starts which, by themselves, are +36.2% YTD. On the heels of earlier horrific coronavirus-related declines, it’s nice to see recent pickups in hotel/motel (+31.0% YTD) and retail/shopping starts (+10.4% YTD). The warehouse category of starts, though, a winner over the past couple of years, is now in the doldrums (-11.9% YTD).
None of the foregoing, though, is as impressive as what’s been happening in the industrial type-of-structure subcategory. Manufacturing starts in July were +11.6% m/m (a restrained gain due to extreme strength in June as well), +311.9% y/y, and +320.0% YTD (see Graph 4).
Table 3: Construction Starts in Some Additional Type of Structure Subcategories
This Industry Snapshot sets out the history, from January 2005 to the present, of 12-month moving ConstructConnect starts averages for a dozen construction types of structures. The moving average (placed in the latest month) approach is designed to capture trends.
There are recent upticks in nearly all the graphs. The only ones still holding back are private office buildings and miscellaneous civil. The former is likely to take a while to regain vitality. The latter will revive with the initiation of a major electric power project, or significant railroad work, and/or one or more big urban rapid transit jobs.
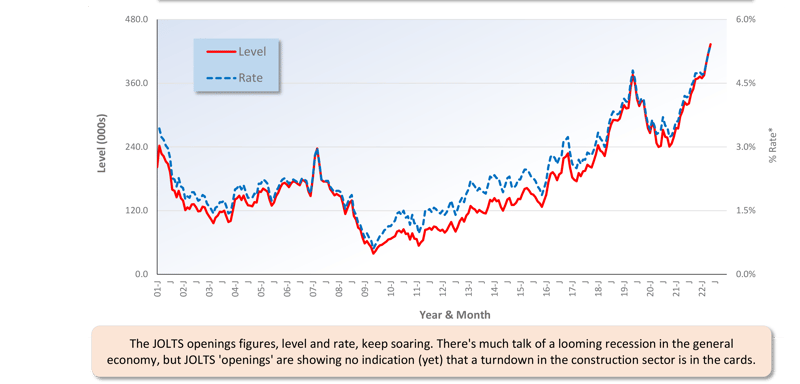
For ease of viewing, Graphs 5 and 6 show smoothed curves (i.e., based on three-month moving averages) for the JOLTS results, openings and hires, pertaining to construction.
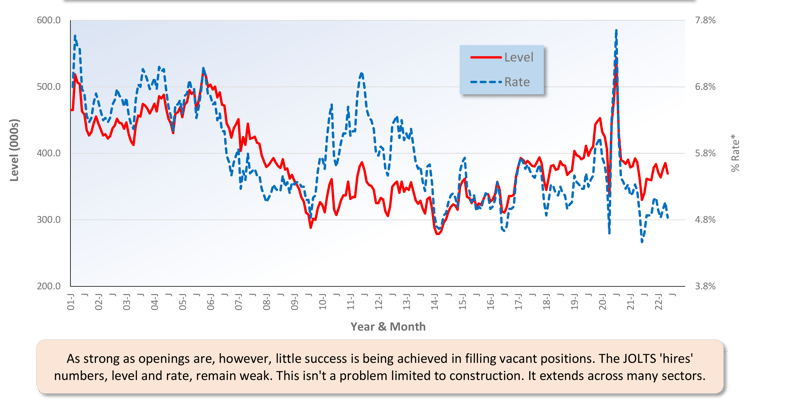
Openings in construction, both as a level and rate, currently remain historically high, but they have moved a little off their peaks of a month ago. More challenging to interpret, though, are the ‘hires’ numbers. Hires as both a level and rate are falling. The rate, in particular, is approaching a multi-year low.
The difficulty in signing up willing qualified workers is not a problem confined to construction. It is prevalent in many sectors and helps explain why, as discussed in the next section, wages are climbing rapidly.
Graph 5: U.S. Construction Job Openings (from JOLTS Report)
(3-month Moving Averages placed in Latest Month)
Graph 6: U.S. Construction Job Hires (from JOLTS Report)
(3-month Moving Averages placed in Latest Month)
Tables B-3 and B-8 of the monthly Employment Situation report, from the BLS, record average hourly and average weekly wages for industry sectors. B-3 is for all employees (i.e., including bosses) on nonfarm payrolls. B-8 is for production and nonsupervisory personnel only (i.e., it excludes bosses). For all jobs and construction, there are eight relevant percentage changes to consider.
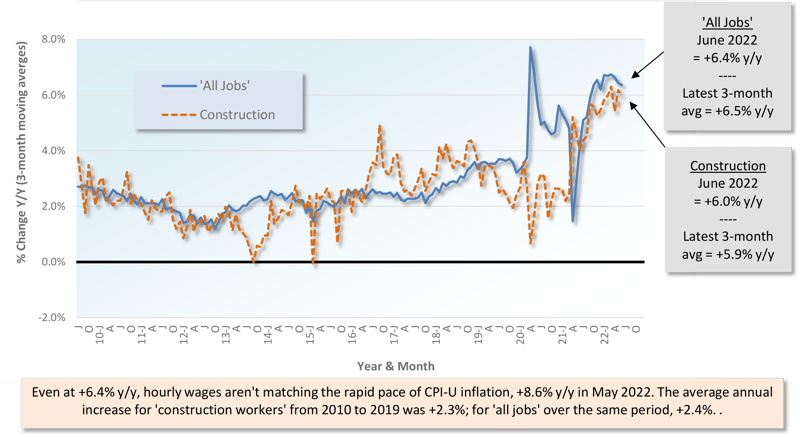
From July 2022’s Table B-3 (including bosses), year-over-year all-jobs earnings were +5.2% hourly and +4.6% weekly. Construction workers, as a subset of all jobs, did somewhat better with y/y hourly and weekly increases of +5.5% in both instances. From Table B-8 for production and non-supervisory workers (i.e., excluding bosses), the all-jobs wage jumps were +6.2% hourly and +5.3% weekly. Construction workers trailed a little hourly, +5.7%, but had the advantage weekly, +6.0%.
Graph 7: Average Hourly Earnings Y/Y - All Jobs & Construction
Graph 8: Average Weekly Earnings Y/Y - All Jobs & Construction
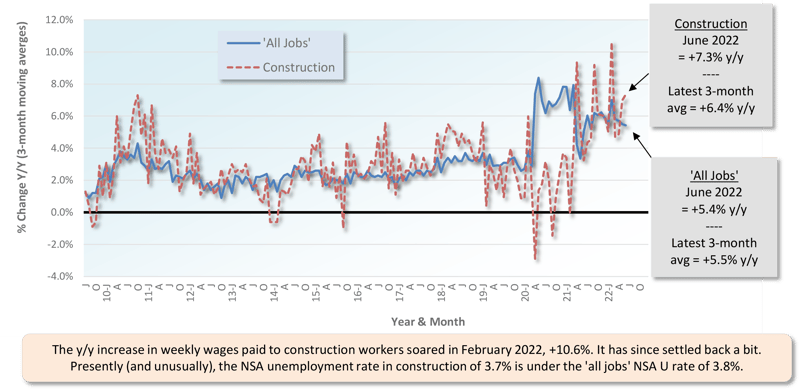
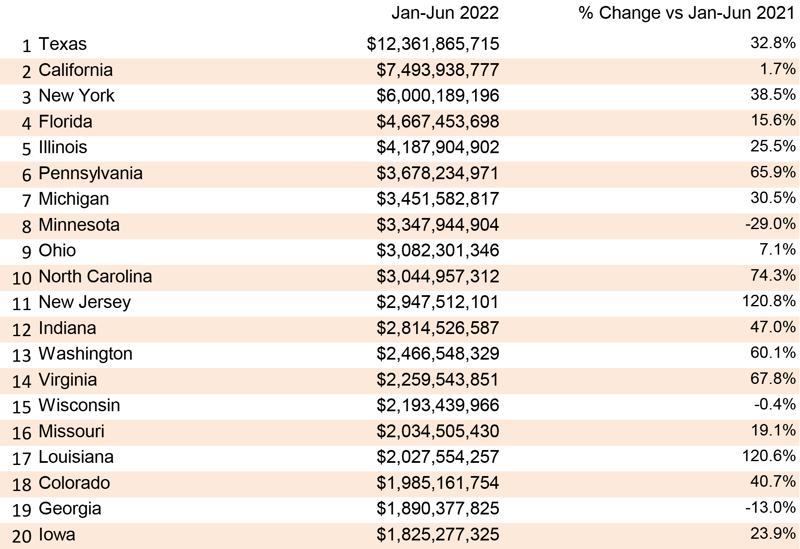
Table 4: 2022 YTD Ranking of Top 20 States by $ Volume of Nonresidential Construction Starts — ConstructConnect®
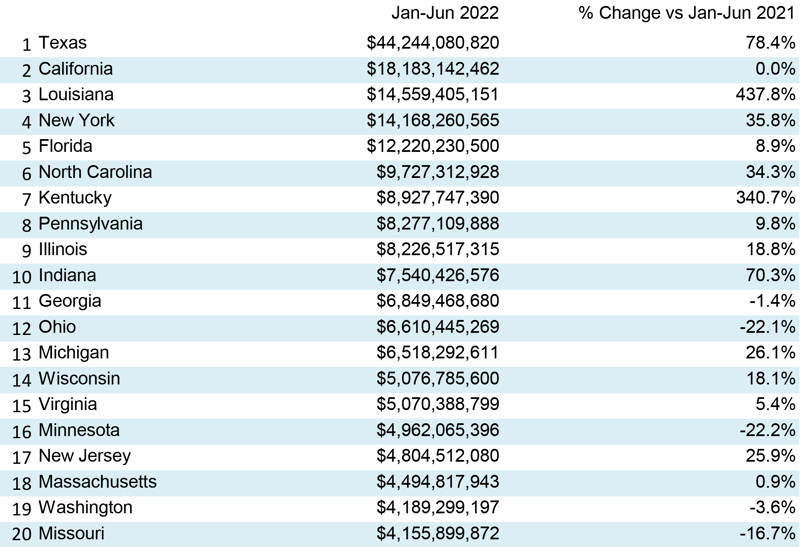
Table 5: 2022 YTD Ranking of Top 20 States by $ Volume of Nonresidential Building Construction Starts — ConstructConnect®
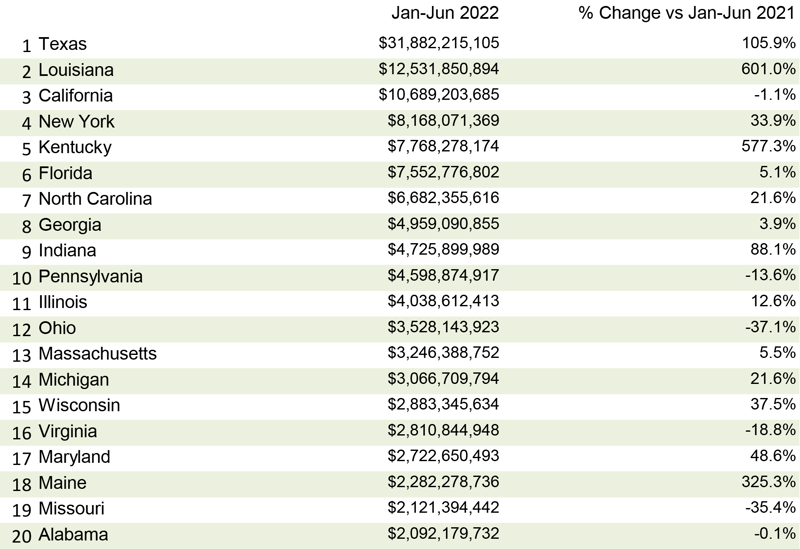
Table 6: 2022 YTD Ranking of Top 20 States by $ Volume of Heavy Engineering/Civil Construction Starts — ConstructConnect®
July 2022’s y/y results for three building-related BLS Producer Price Index series were: (A) construction materials special index, +10.9% (about even with June’s +10.7%); (B) inputs to new construction index, excluding capital investment, labor, and imports, +12.7% (a little under the previous month’s +13.4%); and (C) final demand construction, designed to capture bid prices, +23.1% (going another notch beyond the prior figure of +19.2%).
(A) comes from a data series with a long history, but it’s confined to a limited number of major construction materials. (B) has a shorter history, but it’s more comprehensive in its coverage, although it includes some items (e.g., transportation) that aren’t strictly materials.
What’s important to know, though, is that the y/y change in the bid price index (+19.2%) has caught up with, and moved beyond, the average y/y change for the two material input cost indices ((10.9% + 12.7%)/2 = +11.8%). There were times around a year into the pandemic when contractors weren’t able to adjust their prices enough to recover material cost increases.
Concerning the cost of some major construction material inputs, as revealed in the PPI data set for July 2022 published by the BLS, asphalt is +73.8% y/y; diesel fuel is +71.3%; hot rolled steel bars, plates, and structural shapes, +28.6%; gypsum, +15.8%; ready-mix concrete, +12.0%; cement, +8.9%; aluminum mill shapes, +12.5%; copper wire and cable, -6.1%; and softwood lumber, -7.0%. There’s also an inputs to highways and streets PPI index and it’s +15.4% y/y.
The value of construction starts each month is derived from ConstructConnect’s database of all active construction projects in the United States. Missing project values are estimated with the help of RSMeans’ building cost models. ConstructConnect’s nonresidential construction starts series, because it is comprised of total-value estimates for individual projects, some of which are super-large, has a history of being more volatile than many other leading indicators for the economy.
ConstructConnect’s total residential starts in July 2022 were +11.5% m/m, -3.0% y/y, and -0.1% YTD. Multi-family starts in July were +20.8% m/m, +2.1% y/y, and +4.4% YTD. Single-family starts were +8.5% m/m, -4.8% y/y, and -1.8% YTD.
Including home building with all nonresidential categories, Grand Total starts in July 2022 were +12.0% m/m, +16.8% y/y, and +15.7% YTD.
ConstructConnect adopts a research-assigned start date. In concept, a start is equivalent to ground being broken for a project to proceed. If work is abandoned or rebid, the start date is revised to reflect the new information.
As we progress into the second half of 2022, regional construction data point to flat to slowing activity in most regions. At more granular levels, however, including state and metropolitan statistical areas, there are opportunities to highlight.
Based on data from ConstructConnect’s Expansion Index, the top states for planned projects, now versus a year ago, are as follows: Texas, Ohio, West Virginia, Hawaii, Florida, Vermont, Georgia, Idaho, and Nevada.
Delving deeper, some cities with high Expansion Index readings are Springfield, Ohio; Bay City, Michigan; Jackson, Mississippi; Kokomo, Indiana; and Killeen-Temple-Fort Hood, Texas.
As corroborated by the above results, the change in planned construction activity across the USA moving into the second half of 2022 is well diversified.
Beyond pure geographics, the impetus behind the latest construction activity results is less than evenly distributed. The data points to concentrated activity by select verticals with industrial and government having significantly better prospects. Relative weakness is evident in the commercial and educational verticals. - Michael Guckes, Senior Economist
A rule of thumb is that nonresidential construction is a lagging indicator among economic measures. Companies are hesitant to undertake capital spending until their personnel needs are rapidly expanding and their office square footage or plant footprints are straining capacity. Plus, it helps if profits are abundant. Also, today’s greater tendency to work from home has made office occupancy and the resulting need for construction much more difficult to assess. The rule, however, may not hold true under the present circumstances, with the weakness in such areas as retail spending to be offset by a rich deposit of large industrial and engineering construction projects to mine.
Each month, ConstructConnect publishes information on upcoming construction projects at its Expansion Index.
The Expansion Index, for hundreds of cities in the United States and Canada, calculates the ratio, based on dollar volume, of projects in the planning stage, at present, divided by the comparable figure a year ago. The ratio moves above 1.0 when there is currently a larger dollar volume of construction prospects than there was last year at the same time. The ratio sinks below 1.0 when the opposite is the case. The results are set out in interactive maps for both countries.
Click here to download the Construction Industry Snapshot Package - July 2022 PDF.
Click here for the Top 10 Project Starts in the U.S. - July 2022.
Click here for the Nonresidential Construction Starts Trend Graphs - July 2022.
Table 1: Value of United States Nonresidential Construction Starts July 2022 - ConstrucConnect
*Includes transportation terminals and sports arenas.
Source: ConstructConnect Research Group and ConstructConnect.
Table: ConstructConnect.
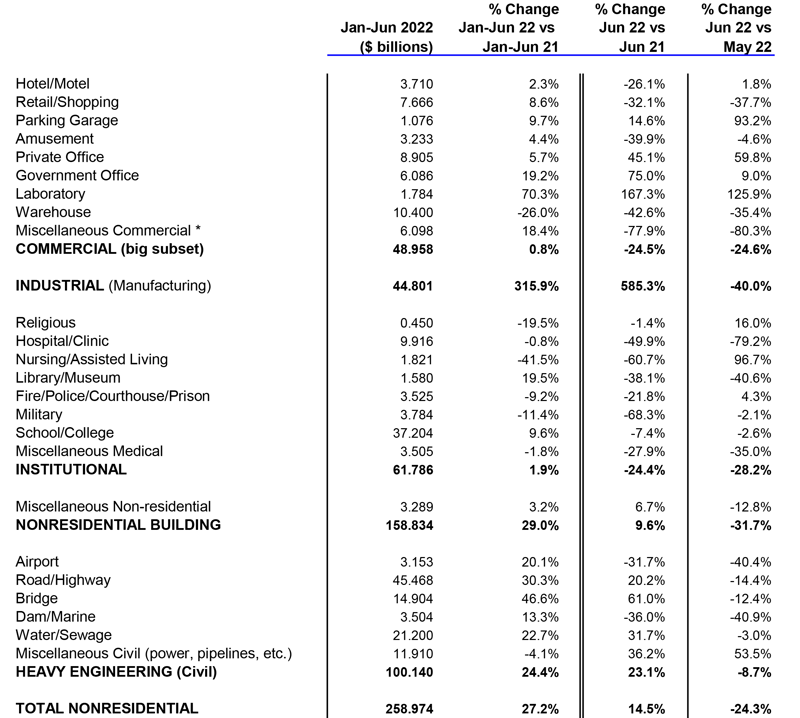
Table 7: Value of United States Construction Starts
ConstructConnect Insight Version – July 2022
Arranged to match the alphabetical category drop-down menus in Insight
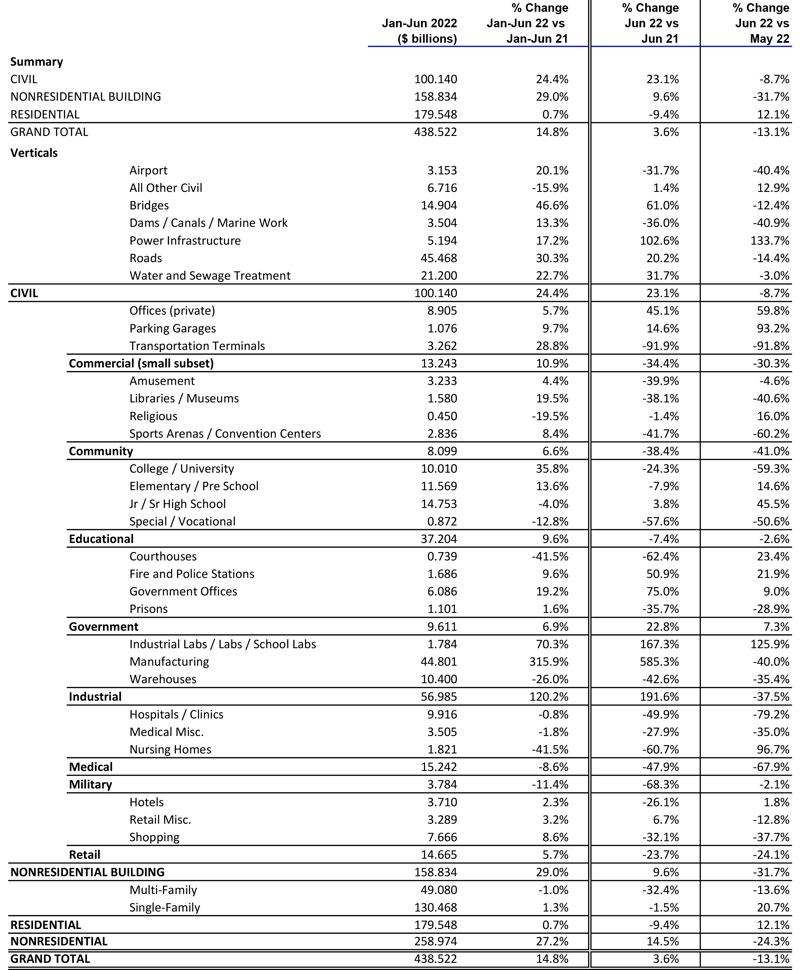
Table 2 conforms to the type-of-structure ordering adopted by many firms and organizations in the industry. Specifically, it breaks nonresidential building into ICI work (i.e., industrial, commercial, and institutional), since each has its own set of economic and demographic drivers. Table 3 presents an alternative, perhaps more user-friendly and intuitive type-of-structure ordering that matches how the data appears in ConstructConnect Insight.
Source: ConstructConnect.
Table: ConstructConnect.
Table 9: U.S. YTD Regional Starts
Nonresidential Construction* — ConstructConnect
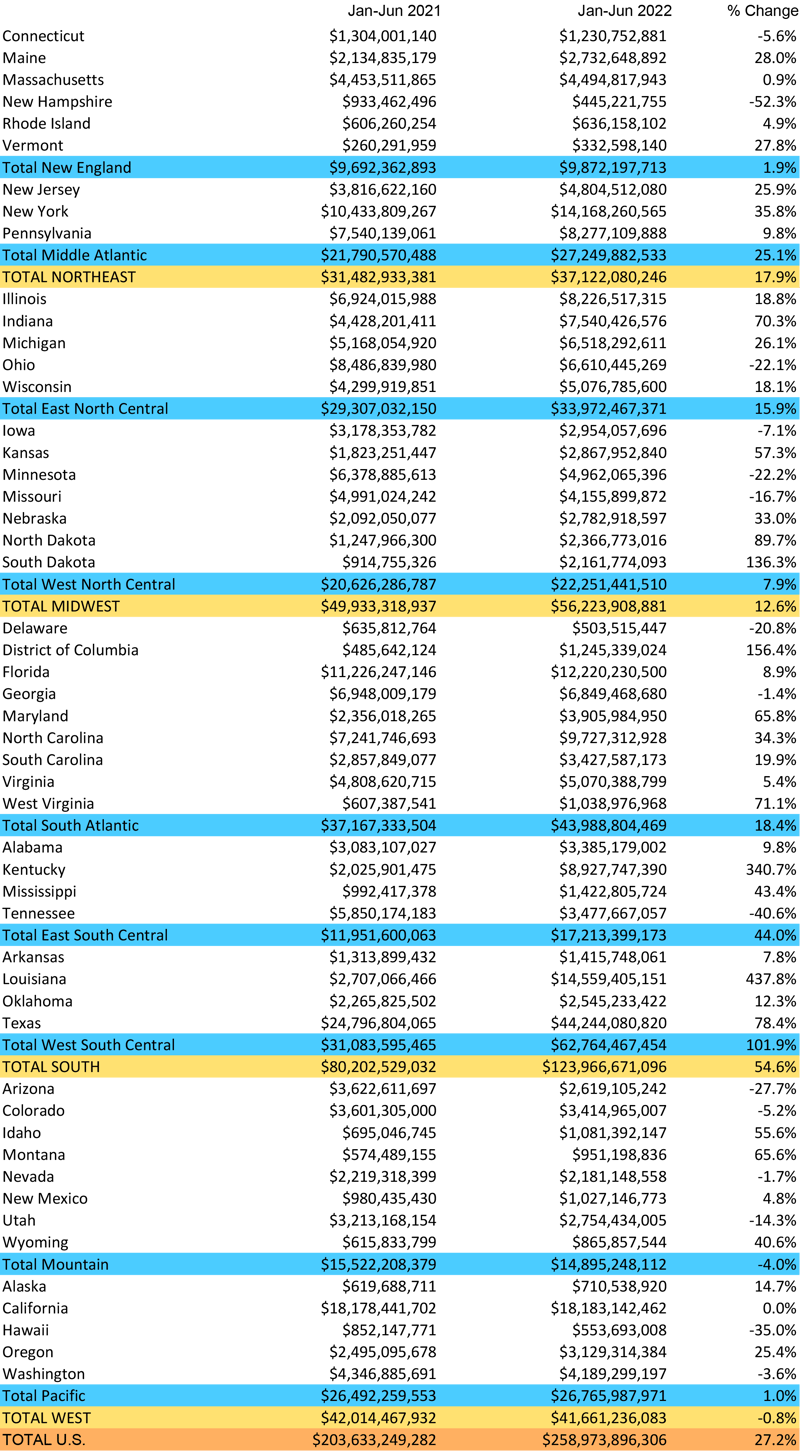
Data Source and Table: ConstructConnect.
Table 10:Value of United States National Construction Starts – July 2022 – ConstructConnect
Billions of current $s, not seasonally adjusted (NSA)
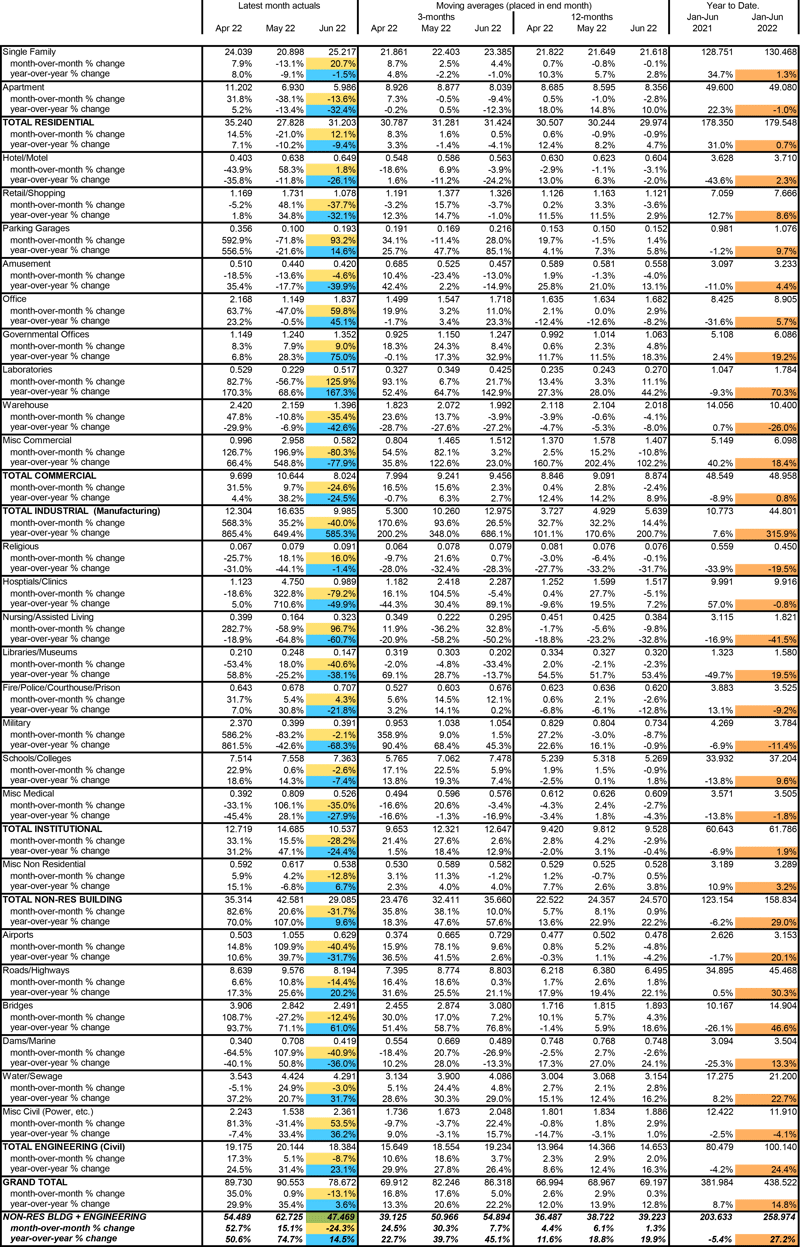
*Figures above are comprised of nonres building and engineering (i.e., residential is omitted).
Data Source and Table: ConstructConnect
ConstructConnect announced today that July's volume of construction starts, excluding residential work, was $53.7 billion.
ConstructConnect announced today that July's volume of construction starts, excluding residential work, was $53.7 billion.
The construction industry added 32,000 new jobs in July and the unemployment rate dropped all the way down to 3.5%.
ConstructConnect announced June 2023’s volume of nonresidential construction starts was $63.2 billion, up +25.5% versus May 2023’s $50.3 billion.