Megaprojects Reignited Starts in September
ConstructConnect announced today that September 2022’s volume of construction starts, excluding residential work, was $51.1 billion, an increase of +26.0 compared with August’s figure of $40.6 billion (originally reported as $40.0 billion).
Following on the heels of a month (August 2022) in which there were no mega-sized project starts (i.e., projects carrying an estimated value of a billion dollars or more each), September roared back on that front. September was like the stretch of four months from April through July of this year when megaproject groundbreakings were quite pronounced.
/industry_snapshot_oct_2022.jpg?width=200&height=224&name=industry_snapshot_oct_2022.jpg)
View this information as an infographic.
Click here to download the complete Construction Industry Snapshot Package - September 2022 PDF.
In April, there were five such projects adding to $17.1 billion; in May, four for $20.0 billion; in June, three for $7.8 billion; and in July, five for $13.3 billion. September’s tally was four outsized projects summing to $14.2 billion. The largest was a semiconductor chipmaking plant for Samsung being built near Austin, Texas. Samsung says it’s planning plenty more such spending in Texas out to 2030.
Some of the biggest construction projects have fixed-in-place target completion dates tied to carbon reduction commitments, either specified in legislation or made to the public. Under these circumstances, interest rate hikes may not be as inhibiting as one might suppose. Also, there are workarounds to be found among corporate bond issuances, specially negotiated borrowing costs, partnership agreements to spread the risk and government tax breaks or grants. More likely to be chilled by the tightening credit conditions and the thoughts of recession are mid-sized and smaller construction projects.
September 2022’s total dollar volume of nonresidential construction starts was up by +19.0% when compared with September 2021. On a year-to-date basis, total nonresidential starts have been +28.5% versus January to September of last year.
To complete the starts picture, the GRAND TOTAL (i.e., adding residential to nonresidential activity) in September 2022 was +8.6% m/m, +8.1% y/y, and +15.1% YTD.
Nonresidential Building Starts Take the Lead
There are three major subcategories of total starts: residential, nonresidential building, and heavy engineering/civil. On a year-to-date percentage-change basis in September, nonresidential building starts shone brightest, +31.8%, with engineering also up resoundingly, +23.2%. Residential, on the other hand, was locked in inertia, -0.8%.
On a month-to-month basis in September, nonresidential building starts again led the way, +50.0%, while both engineering and residential took steps backward, -3.5% and -14.5% respectively.
Y/Y Trailing 12-Month Starts Decelerate Somewhat
Other statistics often beloved by analysts are trailing 12-month results and these are set out for all the various type-of-structure categories in Table 10.
Grand Total TTM starts in September on a month-to-month basis picked up nicely (+0.7%) versus August (+0.1%), although they did not quite measure up to July (+1.1%).
On a year-over-year basis in September, GT TTM starts were ahead in robust fashion, +13.5%, but they were showing a bit of an easing from August’s +14.9% and July’s +15.8%.
Manufacturing Leaps Ahead in PIP Stats
Starts compile the total estimated dollar value and square footage of all projects on which ground is broken in any given month. They lead, by nine months to as much as two years, put-in-place statistics which are analogous to work-in-progress payments as the building of structures proceeds to completion.
PIP numbers cover the universe of construction, new plus all manner of renovation activity, with residential traditionally making up two-fifths (about 40%) of the total and nonresidential, three-fifths (i.e., the bigger portion, at around 60%).
Over the past several years, however, there has been an eye-popping change in the ratio. In 2021’s full-year PIP results, the residential to nonresidential relationship was about half and half. Through August of this present year, 2022, residential now claims a 52.8% share of the total, with nonresidential holding the other 47.2%.
The January-August 2022 over January-August 2021 total dollar volume of PIP construction was +10.9%. Residential was still going gangbusters at +19.4%. Nonresidential was restrained, at +2.8%, although not all of its subcategories were laid back. Manufacturing was +23.6%.
PIP numbers, being more spread out, have smaller peak-over-trough percent-change amplitudes than the starts series. As an additional valuable service for clients and powered by its extensive starts database, ConstructConnect, in partnership with Oxford Economics, a world leader in econometric modeling, has developed put-in-place construction statistics by types of structure for U.S. states, cities, and counties, actuals, and forecasts. ConstructConnect’s PIP numbers are being released quarterly and are featured in a separate report.
Construction More than Held its Own in Total Jobs Increase
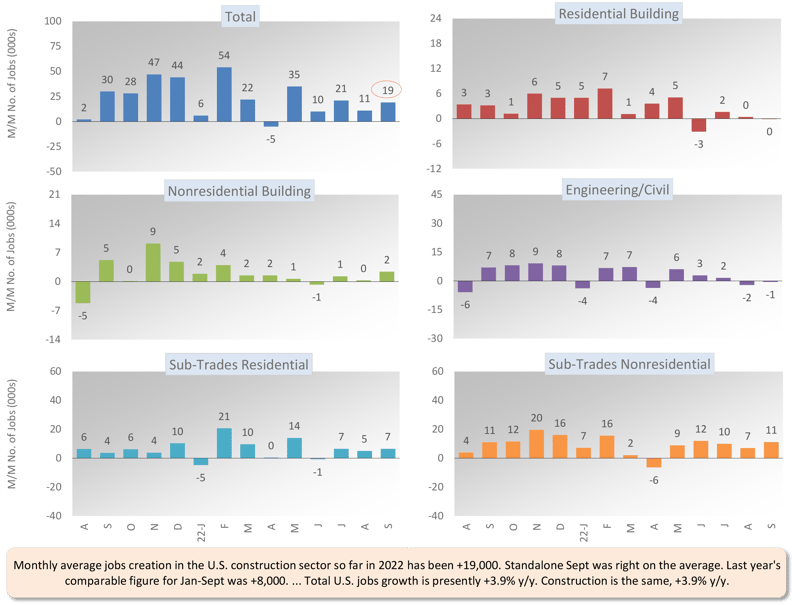
Construction’s share of U.S. total nonfarm employment in the monthly labor market report issued by the Bureau of Labor Statistics (BLS) is slightly more than 5.0%. To claim its proportional share of September’s economywide number-of-jobs increase of +263,000, the figure for construction would be +13,000. The actual result was a little better at +19,000.
It has also been the case that the monthly average increase in construction employment through the first three quarters of the current year has been +19,000. Last year, the monthly average through the Q3 mark was only +8,000. More than half of September’s total staffing gain arose at the nonresidential specialty trade level (+11,000 jobs).
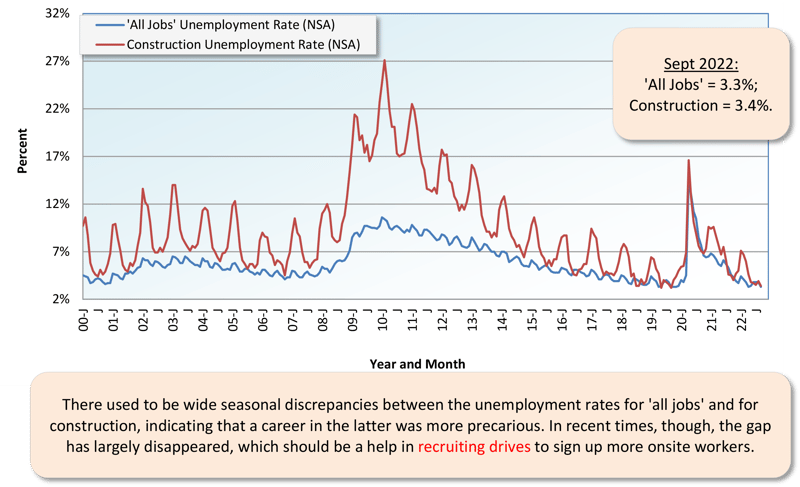
Construction’s not seasonally adjusted unemployment rate in September was 3.4%, making it almost as good as the all jobs NSA U figure of 3.3%. In August, construction workers were looking at a 3.9% NSA U rate and in September 2021, 4.6%.
August’s year-over-year gain in construction employment, at +4.2%, was a little speedier than the all jobs y/y pickup of +4.0%. It also beat manufacturing’s +3.7% jobs gain. The sector hardest hit by the pandemic, leisure and hospitality, saw a y/y jobs leap in August of +9.1%.
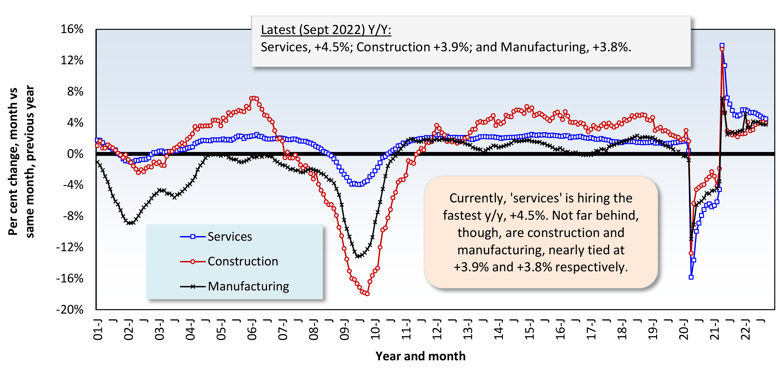
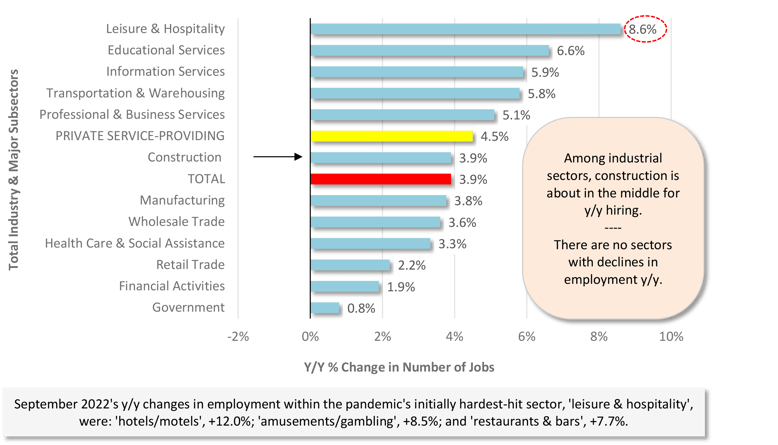
In the latest month, the U.S. construction sector managed the same year-over-year gain in employment as all jobs, +3.9%. At the same time, hiring by manufacturers was slower by the smallest of margins, +3.8% y/y. Private sector services employment, though, was speedier, +4.5% y/y. The leisure and hospitality services sector, still striving towards full recovery after being floored by various waves of the coronavirus, added to its collective payroll by +8.6% y/y.
In other segments of the economy with close ties to construction, the latest y/y percentage changes in employment have been as follows: oil and gas exploration and development, +11.6%; machinery and equipment rental and leasing, +6.9%; architectural and engineering design services, +5.4%; cement and concrete product manufacturing, +3.2%; real estate, +2.9%; and building materials and supplies dealers, -0.3%, or essentially no change.
Design services work leads into later onsite activity. Therefore, the +5.4% metric for the industry noted above is a positive read on the prospects for future in-the-field employment. Offering corroboration has been the Architecture Billings Index from the American Institute of Architects. The ABI in August was 53.3, an improvement on July’s 51.0. (For the ABI, 50.0 is the pivot point that separates more sales from fewer, month to month.) Over the same two-month span, the AIA’s New Project Inquiries index moved upwards to 57.9 from 56.1.
Graph 1: Change in Level of U.S. Construction Employment, Month to Month (M/M) −
Total & by Categories - September 2022
Graph 2: U.S. Manufacturing Versus Construction Employment - September 2022 - Seasonally Adjusted (SA) Payroll Data
.png?width=800&height=654&name=U.S.%20Const%20vs%20Mnfg%20(Sep%2022).png)
Graph 3: U.S. Unemployment Rates: All Jobs & Construction - September 2022 (Not Seasonally Adjusted)
Graph 4: U.S. Employment - September 2022 - % Change Y/Y (Seasonally Adjusted)
Graph 5: U.S. Total & Subsectors Y/Y Jobs Change - September 2022 (Seasonally Adjusted)
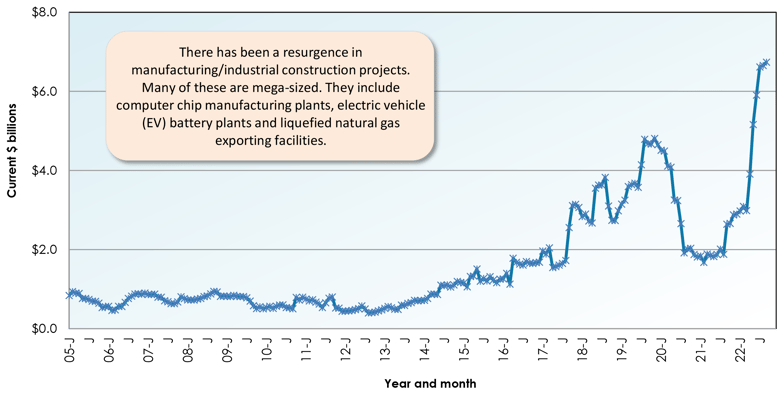
Graph 6: U.S. Manufacturing Construction Starts - ConstructConnect (12-Month Moving Averages)
Pluses and Minuses Among the Type of Structure Subcategories
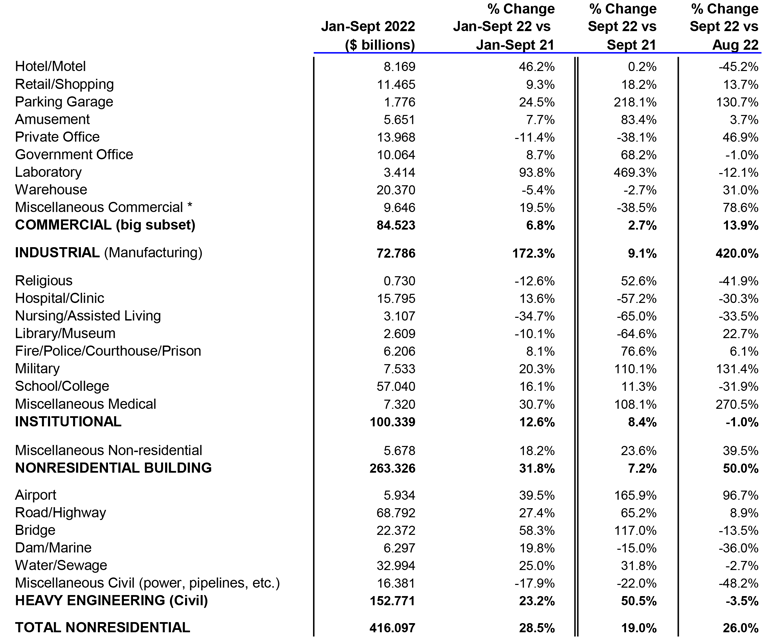
The more than one quarter (+26.0%) increase in September 2022’s total nonresidential starts month-to-month (m/m) was driven mainly by the industrial subcategory (+420.0% - chipmaking plant in Texas), although commercial also recorded a decent gain (+13.9%). Both institutional (-1.0%) and heavy engineering/civil (-3.5%) failed to move forward.
The +19.0% advance of total nonresidential starts in September of this year versus September of last year was due to across-the-board buoyancy in the major subcategories, with engineering in especially fine fettle (+50.5%), followed by industrial (+9.1%), institutional (+8.4%), and commercial (+2.7%).
September’s +28.5% year-to-date upswing in total nonresidential starts was also thanks to a parade of positivity. Performing best was industrial (+172.3%), with engineering (+23.2%), institutional (+12.6%), and commercial (+6.8%) upbeat as well, to varying lesser degrees.
There are two dominant subcategories of total nonresidential starts. When the volumes of roads/highways and schools/colleges are added together, they accounted for 30.2% of September’s total nonresidential starts YTD (i.e., shares of 16.5% and 13.7% respectively).
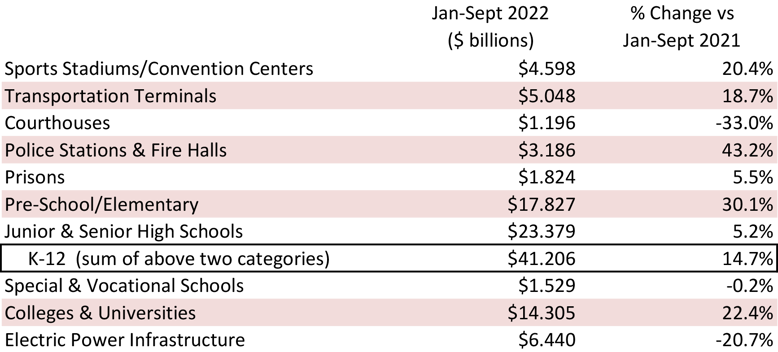
The three percentage-change metrics for street starts in September 2022 were +8.9% m/m, +65.2% y/y, and +27.4% YTD. For educational facility starts, the results were -31.9% m/m, but +11.3% y/y and +16.1% YTD. The +16.1% pickup in school starts through Q3 is owing primarily to preschool and elementary structures, +30.1% and colleges and universities, +22.4% YTD./p>
Important beyond roads within the engineering subcategory are water/sewage and bridge starts. Groundbreakings in the former in September were -2.7% m/m, but +31.8% y/y and +25.0% YTD. For the latter, the results were -13.5% m/m, but +117.0% y/y and +58.3% YTD.
Important beyond schools in institutional are three medical subcategories, i.e., hospitals/clinics, ‘nursing/assisted living, and miscellaneous medical. Their combined starts in September 2022 were +53.5% m/m, -10.3% y/y, and +8.1% YTD. On their own, hospital/clinic starts in the latest month were -30.3% m/m and -57.2% y/y but +13.6% YTD.
Among commercial starts in September, an array of YTD percentage change increases is being headlined by laboratories (+93.8%), with hotels/motels (+46.2%), miscellaneous (+19.5%), retail/shopping (+9.3%), government office buildings (+8.7%), and amusement (+7.7%) in supporting roles. Miscellaneous includes sports stadiums/convention centers (+20.4% YTD) and transportation terminals (+18.7% YTD). Producing weak YTD results within commercial starts so far in 2022 have been warehouses (-5.4%) and private office buildings (-11.4%), although it’s worth noting that m/m, they both did pretty good, +31.0% and +46.9% respectively.
This section wouldn’t be complete without emphasizing how wonderfully industrial starts have been behaving. Lifted by a wealth of mega project initiations, industrial (+420.0% m/m; +9.1% y/y; and +172.3% YTD) has been the standout among the four major type-of-structure subcategories (see Graph 6).
Table 2: Construction Starts in Some Additional Type of Structure Subcategories
Engineering Trend Graphs the Most Upbeat
This Industry Snapshot sets out the history, from January 2005 to the present, of 12-month moving ConstructConnect starts averages for a dozen construction types of structures. The moving-average approach is designed to capture trends. (As a technical note, the moving average is graphed in the ending month.)
With recent ascending curvatures, schools/colleges, roads/highways, water/sewage, and bridges are showing clear signs of uptrends. Retail and hospitals/clinics are continuing along level planes. The slope for private office buildings has not yet reversed its negative course.
Construction Job Openings Continue to Climb
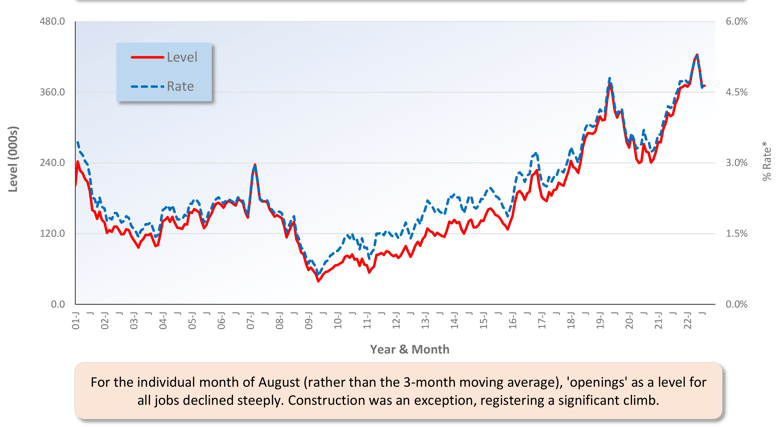
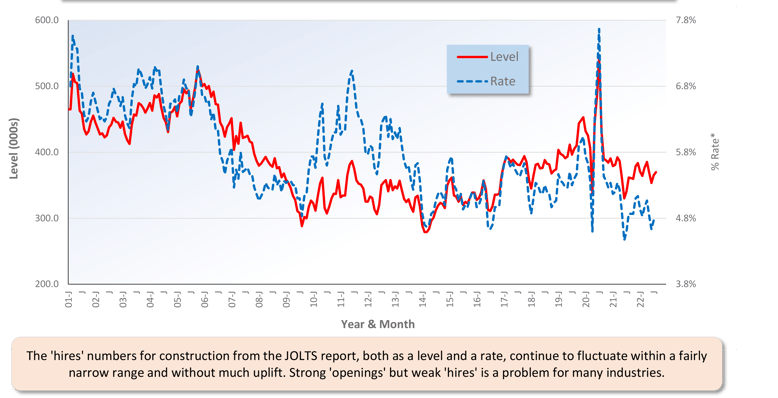
For ease of viewing, Graphs 7 and 8 show smoothed curves (i.e., based on three-month moving averages) for the Job Openings and Labor Turnover Survey results pertaining to construction industry openings and hires.
For the construction sector, the JOLTS story remains the same as it has been for quite some time. There’s an excess of openings, without an accompanying upsurge in hires.
Many other industries have also been experiencing this problem. But a change may be in the wind. In the latest (August) set of JOLTS numbers, openings figures as a level fell in nearly every industry. The one notable exception was construction, where openings continued to climb.
Graph 7: U.S. Construction Job Openings (from JOLTS Report)
(3-month Moving Averages placed in Latest Month)
Graph 8: U.S. Construction Job Hires (from JOLTS Report)
(3-month Moving Averages placed in Latest Month)
Formidable Wage Hikes Throughout the Economy
Tables B-3 and B-8 of the monthly Employment Situation report, from the BLS, record average hourly and average weekly wages for industry sectors. B-3 is for all employees (i.e., including bosses) on nonfarm payrolls. B-8 is for production and nonsupervisory personnel only (i.e., it excludes bosses). For all jobs and construction, there are eight relevant percentage changes to spotlight.
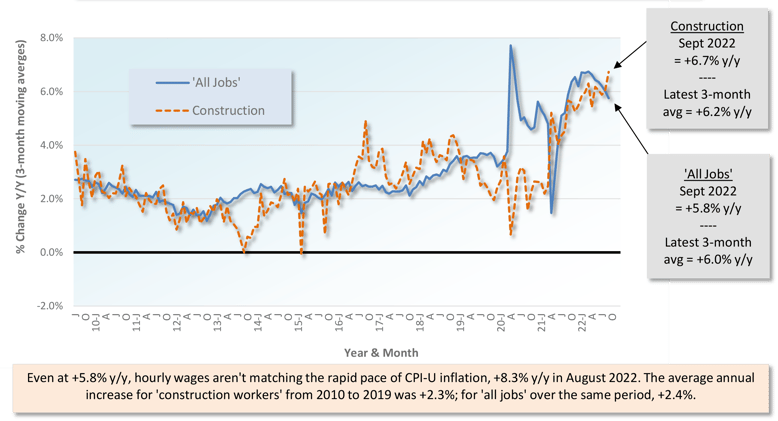
From September 2022’s Table B-3 (including bosses), year-over-year all-jobs earnings were +5.0% hourly and +4.1% weekly. Construction workers, as a subset of all jobs, did better hourly, +5.5%, but fell behind weekly, +3.3%. From Table B-8 for production and nonsupervisory workers (i.e., excluding bosses), the all-jobs wage advances were +5.8% hourly and +4.8% weekly. Construction workers fared better hourly, +6.7%, but they weren’t rewarded as richly weekly, +4.4%.
Graph 9: Average Hourly Earnings Y/Y - All Jobs & Construction
Graph 10: Average Weekly Earnings Y/Y - All Jobs & Construction
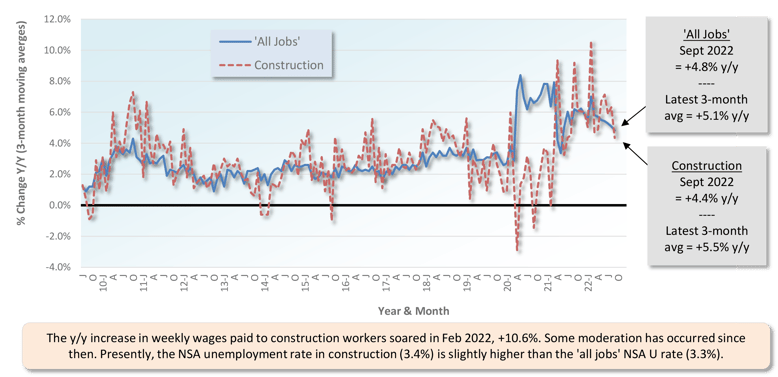
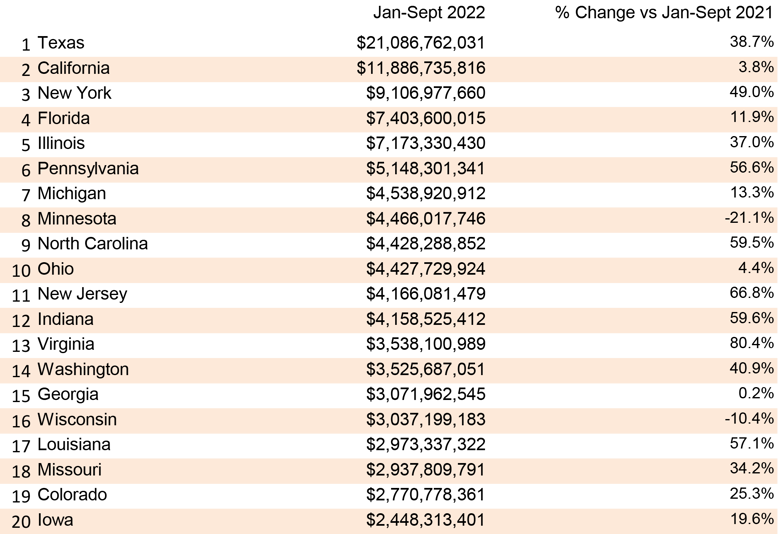
Table 3: 2022 YTD Ranking of Top 20 States by $ Volume of Nonresidential Construction Starts — ConstructConnect®
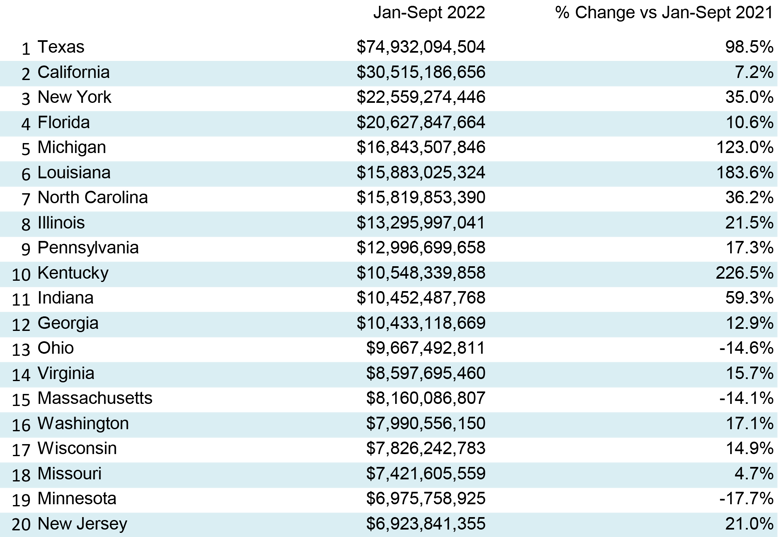
Table 4: 2022 YTD Ranking of Top 20 States by $ Volume of Nonresidential Building Construction Starts — ConstructConnect®
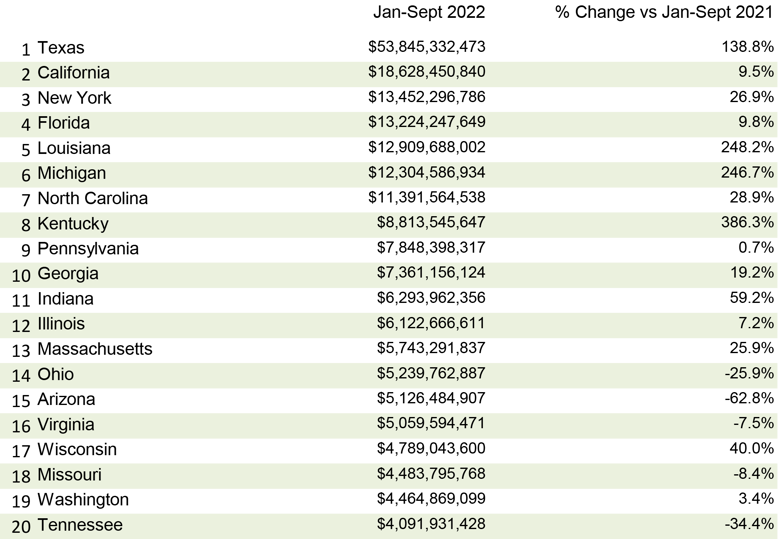
Table 5: 2022 YTD Ranking of Top 20 States by $ Volume of Heavy Engineering/Civil Construction Starts — ConstructConnect®
Reason Returning to Material Inputs Marketplace
September 2022’s y/y results for three building related BLS Producer Price Index (PPI) series were: (A) construction materials special index, +6.2% (moderating from August’s +9.5%); (B) inputs to new construction index, excluding capital investment, labor, and imports, +11.5% (staying the same as in the previous month); and (C) final demand construction, designed to capture bid prices, +23.1% (up minutely from the +22.9% change in August).
(A) comes from a data series with a long history, but it’s confined to a limited number of major construction materials. (B) has a shorter history, but it’s more comprehensive in its coverage, although it includes some items (e.g., transportation) that aren’t strictly materials.
Concerning the cost of some major construction material inputs, as revealed in the PPI data set for September 2022 published by the BLS, there’s some spirited dancing still going on, but the frenzied music is winding down. Diesel fuel is +65.9% y/y; asphalt, +43.3% y/y; gypsum, +18.4%; softwood lumber, +14.5%; hot rolled steel bars, plates, and structural shapes, +12.1%; ready-mix concrete, +11.6%; cement, +10.9%; aluminum mill shapes, -10.8%; and copper wire and cable, -8.7%. There’s an inputs to highways and streets PPI index and it’s +12.9% y/y.
The value of construction starts each month is derived from ConstructConnect’s database of all active construction projects in the United States. Missing project values are estimated with the help of RSMeans’ building cost models. ConstructConnect’s nonresidential construction starts series, because it is comprised of total-value estimates for individual projects, some of which are super-large, has a history of being more volatile than many other leading indicators for the economy.
September 2022’s Grand Total Starts +15.1% YTD
ConstructConnect’s total residential starts in September 2022 were -14.5% m/m, -8.4% y/y, and -0.8% YTD. Multi-family starts were -28.6% m/m, but +19.7% y/y and +14.3% YTD. Single-family starts were -5.2% m/m, -17.9% y/y, and -6.7% YTD.
Including home building with all nonresidential categories, Grand Total starts in September 2022 were +8.6% m/m, +8.1% y/y, and +15.1% YTD.
ConstructConnect adopts a research-assigned start date. In concept, a start is equivalent to ground being broken for a project to proceed. If work is abandoned or rebid, the start date is revised to reflect the new information.
Flexible and Adaptable Strategies for 2023
The rapidly changing pace of events in 2022 means that for many construction firms, plans and strategies for next year may need to be rethought. Consider that mortgage applications for the week ending October 7, 2022, were down 39% from the same period a year ago. Such a substantial change points to a construction market that is likely to be very different in 2023.
The cooling of residential construction will mean the loss of the most powerful driver of total U.S. construction spending since 2020. Taking its place will be a growing list of nonresidential megaprojects of $1 billion or more each. The present list of megaprojects breaking ground constitutes a greater portion of total construction spending than at any time in recent history.
As the transition unfolds, material and labor requirements will naturally shift to where they are most valued. Excess supplies of labor and materials formerly involved in residential construction work will likely shift the cost dynamics downwards for the first time since COVID-19. Distributors and suppliers that fail to prepare for this change could end up holding excessive and unnecessary levels of residential products. They’ll be tying up capital that could otherwise be productively and profitably spent on commercial and civil construction-related products.
Knowing how to proactively respond to the market will require an eyes-wide-open mentality and the careful monitoring of industry data. The construction industry’s success in 2023 will be determined by the willingness of business leaders to quickly adapt to changing circumstances. - Michael Guckes, Senior Economist
Expansion Index Monitors Construction Prospects
A rule of thumb is that nonresidential construction is a lagging indicator among economic measures. Companies are hesitant to undertake capital spending until their personnel needs are rapidly expanding and their office square footage or plant footprints are straining capacity. Plus, it helps if profits are abundant. Also, today’s greater tendency to work from home has made office occupancy and the resulting need for construction much more difficult to assess. The rule, however, may not hold true under the present circumstances, with the weakness in such areas as retail spending to be offset by a rich deposit of large industrial and engineering construction projects to mine.
Each month, ConstructConnect publishes information on upcoming construction projects at its Expansion Index.
The Expansion Index, for hundreds of cities in the United States and Canada, calculates the ratio, based on dollar volume, of projects in the planning stage, at present, divided by the comparable figure a year ago. The ratio moves above 1.0 when there is currently a larger dollar volume of construction prospects than there was last year at the same time. The ratio sinks below 1.0 when the opposite is the case. The results are set out in interactive maps for both countries.
Click here to download the Construction Industry Snapshot Package - September 2022 PDF.
Click here for the Top 10 Project Starts in the U.S. - September 2022.
Click here for the Nonresidential Construction Starts Trend Graphs - September 2022.
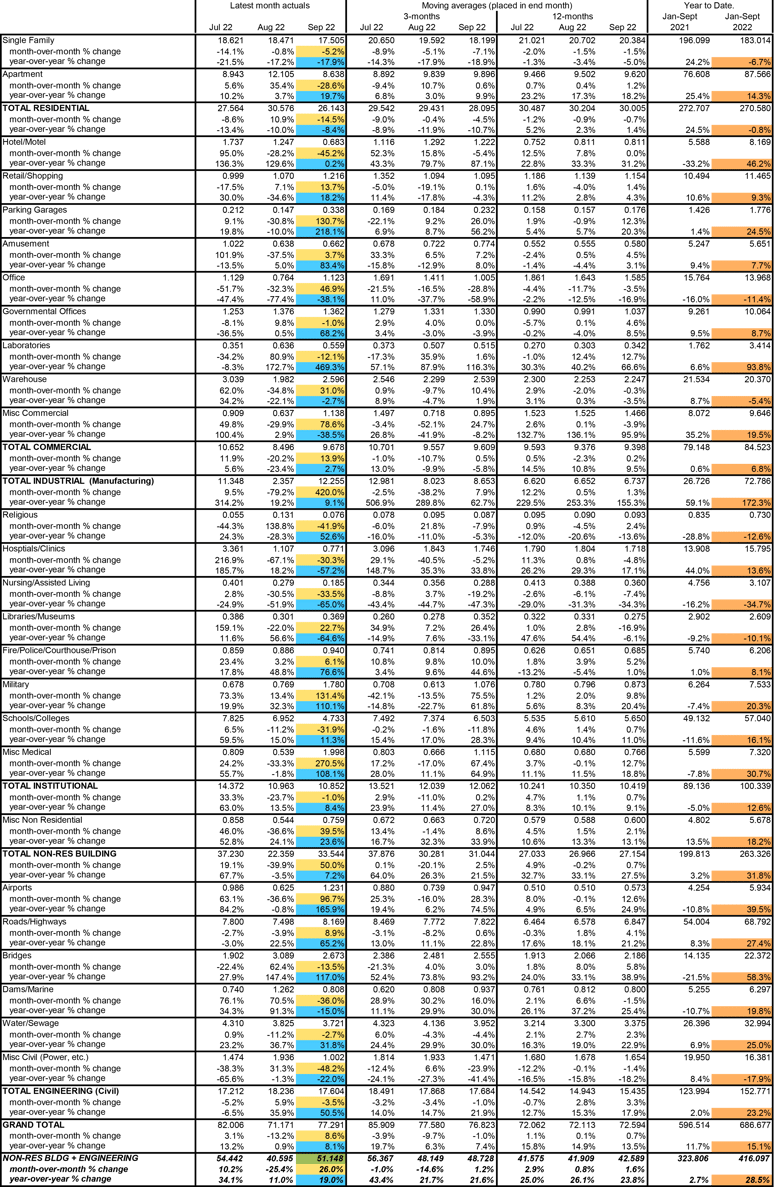
Table 1: Value of United States Nonresidential Construction Starts August 2022 - ConstrucConnect
*Includes transportation terminals and sports arenas.
Source: ConstructConnect Research Group and ConstructConnect.
Table: ConstructConnect.
Table 6: Value of United States Construction Starts
ConstructConnect Insight Version – July 2022
Arranged to match the alphabetical category drop-down menus in Insight
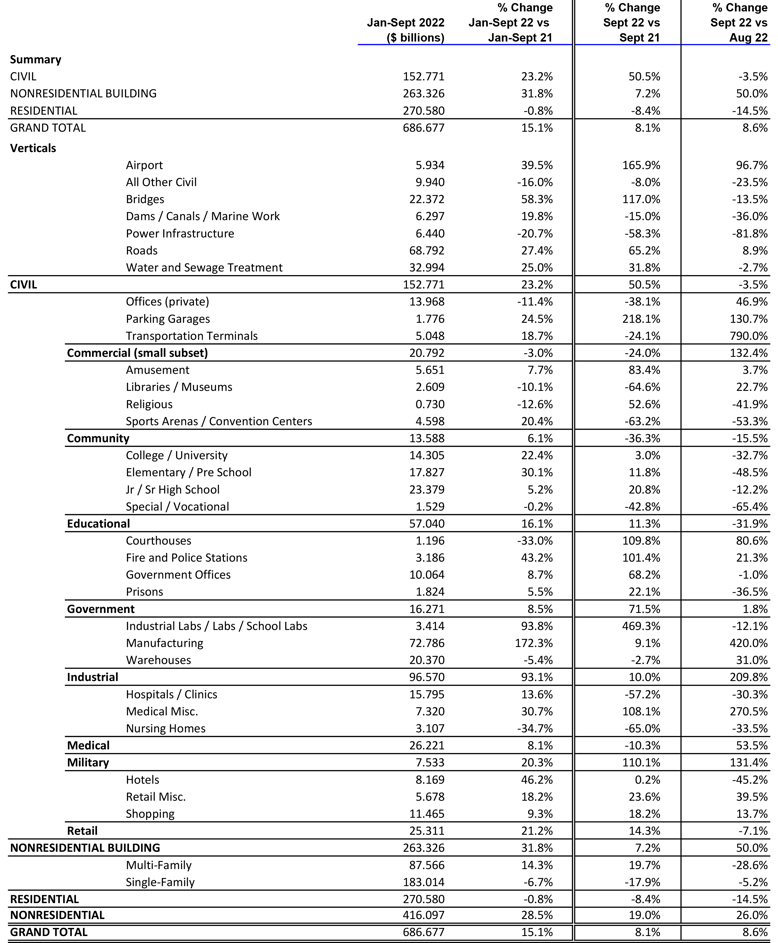
Table 2 conforms to the type-of-structure ordering adopted by many firms and organizations in the industry. Specifically, it breaks nonresidential building into ICI work (i.e., industrial, commercial, and institutional), since each has its own set of economic and demographic drivers. Table 3 presents an alternative, perhaps more user-friendly and intuitive type-of-structure ordering that matches how the data appears in ConstructConnect Insight.
Source: ConstructConnect.
Table: ConstructConnect.
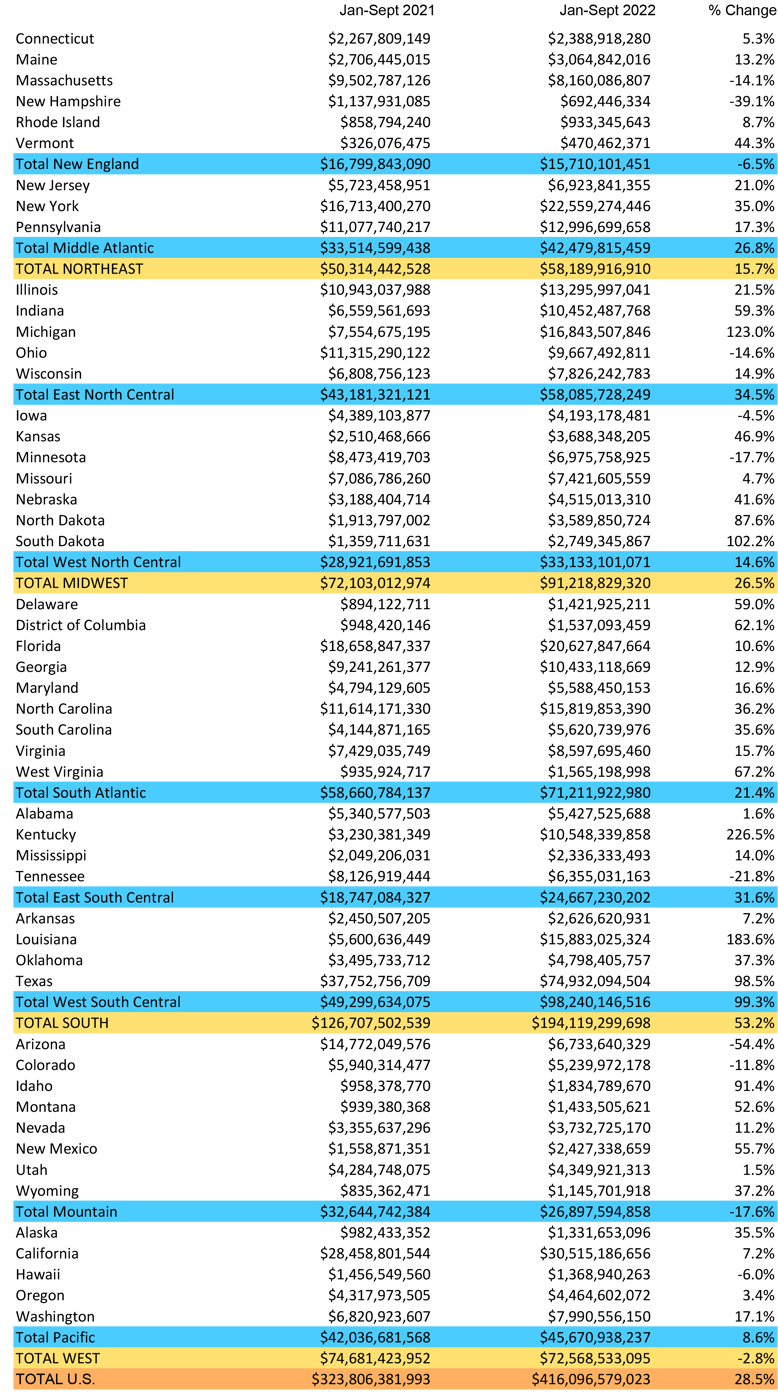
Table 8: U.S. YTD Regional Starts
Nonresidential Construction* — ConstructConnect
Data Source and Table: ConstructConnect.
Table 9: Value of United States National Construction Starts – July 2022 – ConstructConnect
Billions of current $s, not seasonally adjusted (NSA)
*Figures above are comprised of nonres building and engineering (i.e., residential is omitted).
Data Source and Table: ConstructConnect

/industry-snapshot_september.jpg)