May’s Nonresidential Construction Starts +4% M/M, -30% Y/Y, and +2% YTD
ConstructConnect's May 2023 volume of nonresidential construction starts was $49.2 billion, up +4.3% versus April 2023’s figure of $47.1 billion

ConstructConnect announced today that March 2023’s volume of construction starts, excluding residential work, was $47.6 billion, an increase of +45.0% versus February 2023’s figure of $32.8 billion (originally reported as $33.0 billion).
Launching in March were two mega-sized projects carrying a combined value of $6.5 billion. Green-lighted were a Honda and LG Energy Solutions battery plant in Ohio, $3.5 billion, and the Pikka North Slope oilfield development in Prudhoe Bay, Alaska, $3.0 billion. Megaprojects are defined as carrying estimated values of a billion or more each.
/industry-snapshot_April_2023.jpg)
Click here to download the complete Construction Industry Snapshot Package - April 2023 PDF.
February’s megaproject tally was two for $3.6 billion; January’s, three for $14.6 billion. Looking at nonresidential starts in the first three months of this year, exclusive of megaprojects, yields the following dollar volumes: January, $42.6 billion; February, $29.2 billion; and March, $41.1 billion. January and March were basically a match, while February was a soft spot.
In the first quarter of last year, there was only one megaproject start, $2.0 for a wind farm in New York. From the second quarter of last year through to the end of 2022, however, there was a bursting forth of megaproject initiations beyond what has ever been seen before.
Returning to March 2023’s total value of nonresidential construction starts (i.e., megaprojects plus all others), they were +25.5% when compared with the same month of last year. And on a year-to-date basis, they were +35.7% versus the first quarter of 2022.
To complete the overview picture, the GRAND TOTAL dollar volume (i.e., adding residential to nonresidential activity) of starts in March 2023 was +37.3% m/m, -0.4% y/y, and +5.0% YTD.
Other statistics often beloved by analysts are trailing twelve-month results, and these are set out for all the various type-of-structure categories in Table 9.
Grand Total TTM starts in March, on a month-to-month basis, stayed even, 0.0%, which was an improvement relative to February, when they were -0.6%, but a weakening from January, when they were +1.7%.
On a year-over-year basis, Grand Total TTM starts in March stayed bullish, but they also contributed to a fading pattern that has seen +20.5% in January fade to +18.2% in February and further backstep to +17.8% in the latest month.
Starts compile the total estimated dollar value and square footage of all projects on which ground is broken in any given month. They lead, by nine months to as much as two years, put-in-place statistics from the Census Bureau, which are analogous to work-in-progress payments as the building of structures proceeds to completion.
PIP numbers cover the universe of construction, new plus all manner of renovation activity, with residential traditionally (i.e., over the decade preceding the pandemic) making up two-fifths (about 40%) of the total, and nonresidential, three-fifths (i.e., the bigger portion, at around 60%).
In 2021 and 2022, there were dramatic changes in the proportional shares of the total put-in-place dollar volumes taken by residential versus nonresidential. In 2021’s full-year PIP results, the relationship was about half and half, with residential at 49.4% and nonresidential, at 50.6%. In 2022, residential finally succeeded in claiming the larger share of total, 50.7% to 49.4% for nonresidential.
This new relationship, given the higher interest rate regime, could not be expected to hold. Higher interest rates, which harm affordability, have an almost immediate negative impact on housing demand. True to historical form, residential’s year-to-date share of total PIP dollars through February of this year has retreated to 45.8%. (Through February of last year, its share was 51.1% of the total.)
The reported PIP numbers from the Census Bureau are always a month behind the starts data. The total dollar volume of construction put-in-place through February of this year has been +5.9%, with residential in the doldrums at -5.1%, and nonresidential joyous, at +17.5%.
Nonresidential’s leading subsector for year-to-date percentage change (2023/2022) has been manufacturing, +53.0%. Lodging has also experienced an outsized jump, +38.8%. Commercial (which is largely retail), highway and street, water delivery and treatment, and conservation and development have all managed year-to-date climbs of about +20%, or one-fifth.
PIP numbers, being more spread out, have smaller peak-over-trough percent-change amplitudes than the starts series. As an additional valuable service for clients and powered by its extensive starts database, ConstructConnect, in partnership with Oxford Economics, a world leader in econometric modeling, has developed put-in-place construction statistics by types of structure for U.S. states, cities, and counties, actuals and forecasts. ConstructConnect’s PIP numbers are released quarterly and are featured in a separate reporting system.
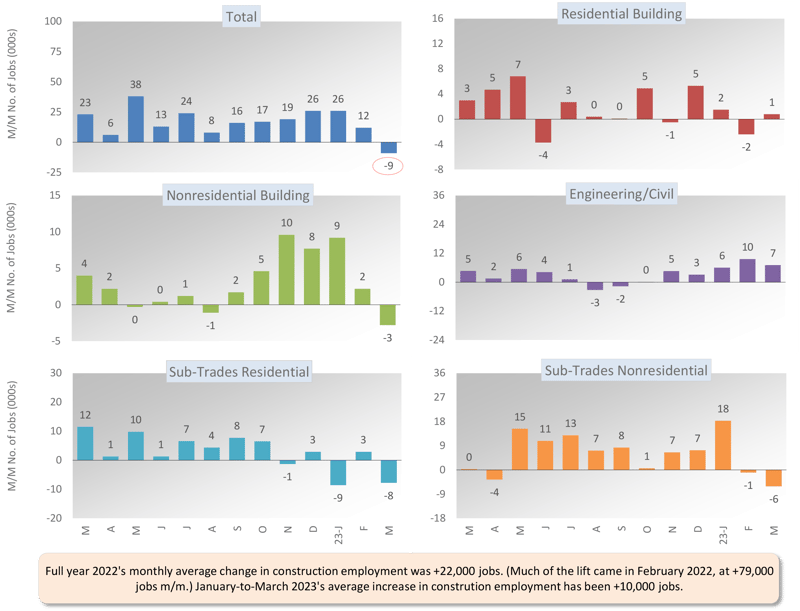
Construction’s share of U.S. total non-farm employment in the monthly labor market report issued by the Bureau of Labor Statistics (BLS) is slightly more than 5.0%. Accordingly, to claim its rightful portion of March’s +236,000 economy-wide number-of-jobs advance, the figure for construction would have needed to be +12,000. Instead, total construction employment was a disappointing -9,000 jobs. Much of the decline was attributable to staff trimming by residential and nonresidential sub-trade contractors, -8,000 and -6,000 jobs, respectively (see Graph 1).
Construction’s not seasonally adjusted unemployment rate in February was 6.6%, down from January’s 6.9%, and a little below year-ago February’s 6.7%.
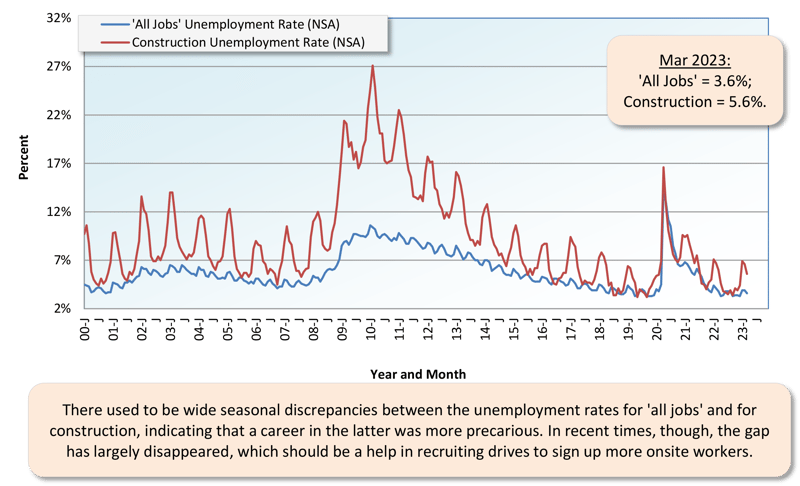
Construction’s not seasonally adjusted (NSA) unemployment rate in March was 5.6%, down from February’s 6.6%, and a little under March 2022’s 6.0%. With spring underway, seasonality (i.e., more activity due to warmer weather) will soon be working to the benefit of construction’s unemployment rate (see the seasonal pattern in Graph 3.)
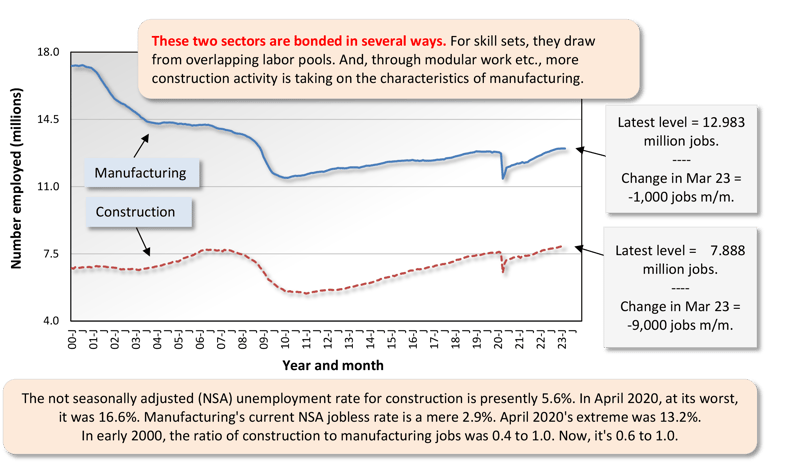
March’s NSA U rate for construction of 5.6% was higher than the nation’s all jobs figure of 3.6%. It was also above manufacturing’s 2.9%. Both the manufacturing and construction sectors are in the goods-producing segment of the economy (i.e., as opposed to private services-providing), and there is considerable overlap between their labor pools. Manufacturing’s employment status in March was almost unchanged month to month, -1,000 jobs (see Graph 2).
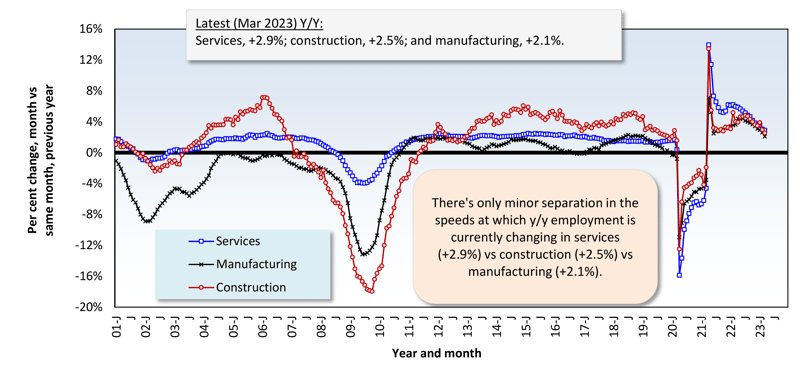
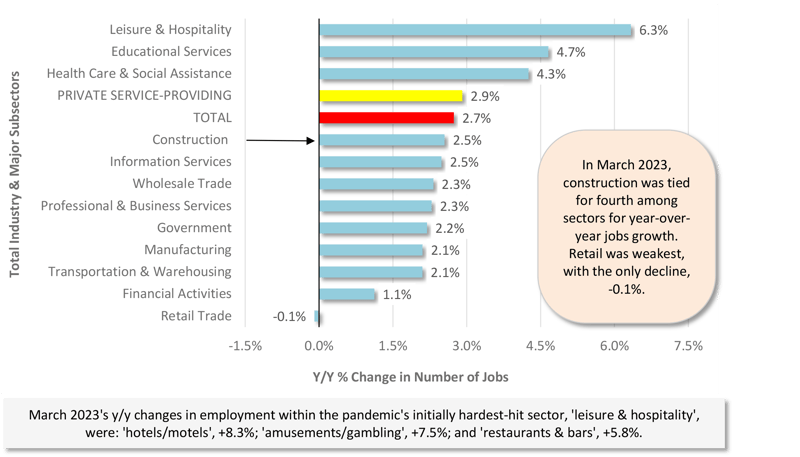
In March, U.S. total employment was +2.7% year over year. Private services-providing employment was ahead by a little more, +2.9% y/y. Construction’s jobs count was +2.5% y/y, and manufacturing’s was +2.1% y/y. Setting the fastest year-over-year pace for jobs growth among all industrial sectors was leisure and hospitality, +6.3% (see Graph 5).
In other segments of the economy with close ties to construction, the latest y/y percentage changes in employment were as follows: architectural and engineering design services, +5.1%; oil and gas exploration and development, +4.4%; machinery and equipment rental and leasing, +4.2%; cement and concrete product manufacturing, +3.1%; real estate, +2.5%; and building materials and supplies dealers, -2.9%.
Design services work at architectural and engineering firms is a vital early-stage cog in the entire construction process that eventually leads to activity in the field. Therefore, the +5.1% y/y gain for jobs in the sector sends an upbeat message. Unfortunately, the Architecture Billings Index from the American Institute of Architects isn’t singing quite the same cheery tune. For the fifth month in a row, the ABI stayed under 50, and in February, it pulled back to 48.0 from 49.3 in January. For reference, a figure of 50.0 is the pivot point for the ABI. Below it, revenues for design firms are shrinking; above it, they’re expanding. The AIA’s latest New Inquiries Index reading, however, is encouraging. Its current level is 55.0.
Graph 1: Change in Level of U.S. Construction Employment, Month to Month (M/M) − Total & by Categories - March 2023
Graph 2: U.S. Manufacturing Versus Construction Employment - March 2023 - Seasonally Adjusted Payroll Data
Graph 3: U.S. Unemployment Rates: All Jobs & Construction - March 2023 (Not Seasonally Adjusted)
Graph 4: U.S. Employment - March 2023 - % Change Y/Y (Seasonally Adjusted)
Graph 5: U.S. Total & Subsectors Y/Y Jobs Change - March 2023 (Seasonally Adjusted)
Graph 6: U.S. Manufacturing Construction Starts - ConstructConnect (12-Month Moving Averages)
The +45.0% month-to-month upsurge in March’s total nonresidential starts was, in large measure, due to an eye-catching bump-up delivered by the industrial subcategory (+174.7%). Engineering (+49.8%) and institutional (+49.4%) also lent strong helping hands. Commercial recorded an advance, but it was relatively minor (+4.0%).
The +25.5% pickup in the dollar volume of total nonresidential starts in March 2023 versus March 2022 (y/y) was also primarily thanks to industrial work (+94.3%), although engineering (+33.6%) and institutional (+22.9%) made significant contributions as well. Commercial was a backslider (-3.0%).
On a year-to-date basis through the first three months of 2023, total nonresidential starts were ahead of 2022’s Q1 dollar volume figure by more than a third (+35.7%). Again, it was industrial (+193.6%) at the forefront. Institutional (+37.3%) and engineering (+29.9%) were supportive sidekicks. Commercial (-2.2%) failed to make any headway.
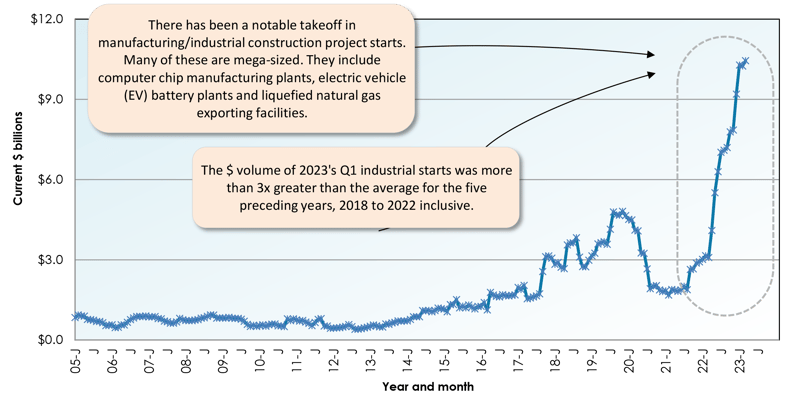
There’s a theme that’s pervasive in the preceding three paragraphs. Of late, industrial (and, by extension, manufacturing) construction starts have been skyrocketing. The dollar volume of 2023’s Q1 industrial starts was more than three times greater than the average for industrial starts for the five prior years, from 2018 to 2022 inclusive (see Graph 6).
Usually, about a third of all nonresidential starts derive from just two subcategory type-of-structure designations, roads/highways and schools/colleges. Their shares of total so far in 2023, at 17.4% and 13.7%, respectively, have added to 31.1%.
The three percentage-change metrics for street starts in March were +46.3% m/m, +10.8% y/y, and +26.4% YTD. For educational facility starts, the results in the latest month were +37.3% m/m, +18.7% y/y, and +26.3% YTD. Further, with respect to educational facilities, college and university starts have stormed ahead most vigorously, +38.5% (see Table 2).
Important beyond roads within the engineering subcategory are water/sewage and bridge starts. The results for the former in March were +50.1% m/m, +14.1% y/y, and +19.7% YTD. For the latter, they were +60.4% m/m, +39.2% y/y, and +18.3% YTD.
February’s three metrics for miscellaneous civil starts, which include power, railroad, and pipeline components, were impressive across the board: +75.5% m/m, +259.9% y/y, and +64.9% YTD.
Important beyond schools in institutional are three medical subcategories, i.e., hospitals/clinics, nursing/assisted living, and miscellaneous medical. Their combined starts in March were +22.8% m/m, -26.5% y/y, and +25.6% YTD. The dollar volume of hospital project starts on their own year-to-date has been +90.1%.
The military subcategory in March generated outstanding percentage-change results: +200.9% m/m; +447.3% y/y; and +563.9% YTD.
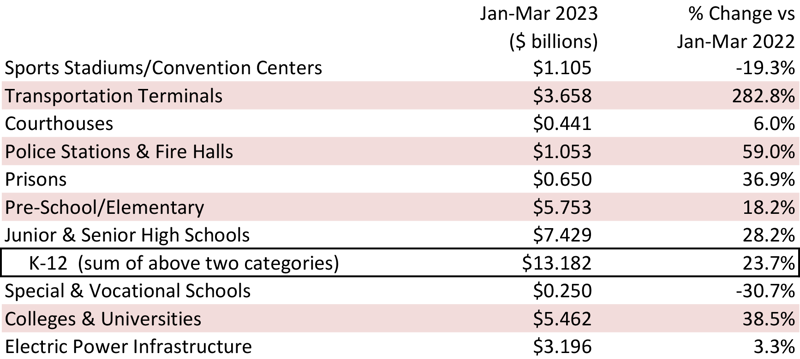
Among commercial subcategories in March, there were month-over-month increases of about +50.0% or more for hotels/motels, amusement, private offices, and warehouses. Laboratories were +560.2% m/m, but that was due to a low base figure. Nevertheless, the commercial subcategories with gains YTD is limited; amusement (+26.7%); government offices (+48.5%); laboratories (+66.1%); and miscellaneous (+104.9%). The latter owes its uptick to transportation terminals (+282.8% YTD).
Table 2: Construction Starts in Some Additional Type of Structure Subcategories
In January, the Jobs Openings and Labor Turnover Survey report showcased the largest drop in construction job openings in the history of the series, dating back to December 2000. Some decline had been expected, with single-family housing starts on the wane, but not to the extent of -205,000. The latest JOLTS report, for February, confirms that there was something odd about January’s number. Maybe some coverage was missed, or the seasonal adjustment factor was off. Anyway, in February, construction job openings climbed by +129,000, restoring more than half of January’s supposed plunge.
Nevertheless, it does seem that openings and hires in construction are on a path that’s moving sideways at best, and slightly to the downside at worst, for now (see Graphs 7 and 8). As for openings and hires economywide, they are both clearly past their peak and moderating in an easily discernible fashion.
This Industry Snapshot sets out the history, from January 2005 to the present, of 12-month moving ConstructConnect starts averages for a dozen construction types of structures. The moving-average approach is designed to capture trends. (As a technical note, the moving average is graphed at the ending month.)
The key overview message is that there are only a couple of instances where the slopes of the trend graphs are obviously still falling, retail and private offices. The slopes in all the other graphs are either climbing or more or less holding their ground.
Tables B-3 and B-8 of the monthly Employment Situation report, from the BLS, record average hourly and average weekly wages for industry sectors. B-3 is for all employees (i.e., including bosses) on nonfarm payrolls. B-8 is for production and nonsupervisory personnel only (i.e., it excludes bosses). For all jobs and construction, there are eight relevant percentage changes to follow.
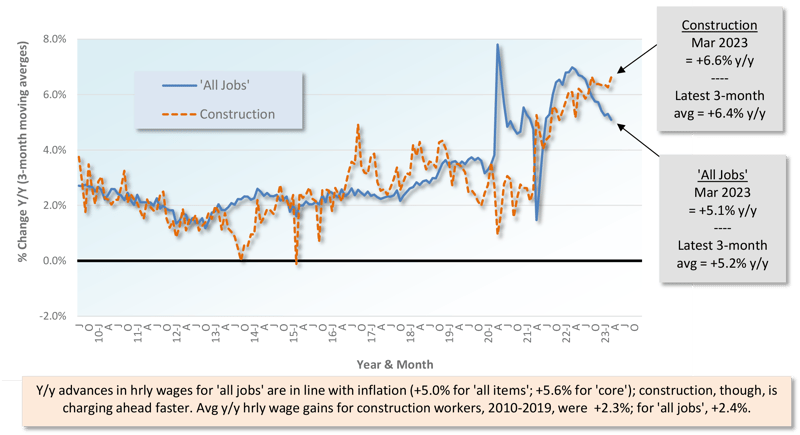
From March 2023’s Table B-3 (including bosses), y/y all-jobs earnings were +4.2% hourly and +3.3% weekly. Compensation hikes for construction workers, as a subset of all jobs, were better, at +5.4% hourly and +5.9% weekly. From Table B-8 for production and non-supervisory workers (i.e., excluding bosses), the y/y all-jobs paycheck advances were +5.1% hourly and +4.5% weekly. Those substantial gains, though, were once again eclipsed by construction workers whose wages sped ahead by +6.6% y/y hourly and +7.4% y/y weekly.
The earnings of construction workers compare favorably, from a purchasing power point of view, with inflation. March’s Consumer Price Index (CPI) numbers were +5.0% for all items and +5.6% for core, which omits highly volatile food and energy items (see Graphs 9 and 10).
Graph 9: Average Hourly Earnings Y/Y - All Jobs & Construction
Graph 10: Average Weekly Earnings Y/Y - All Jobs & Construction
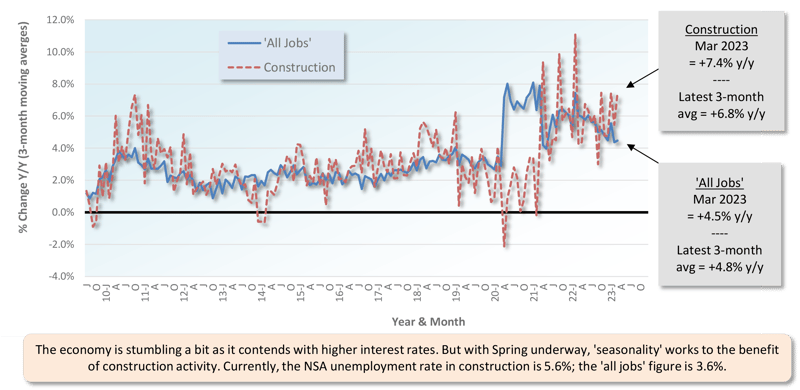
Table 3: 2023 YTD Ranking of Top 20 States by $ Volume of Nonresidential Construction Starts — ConstructConnect®
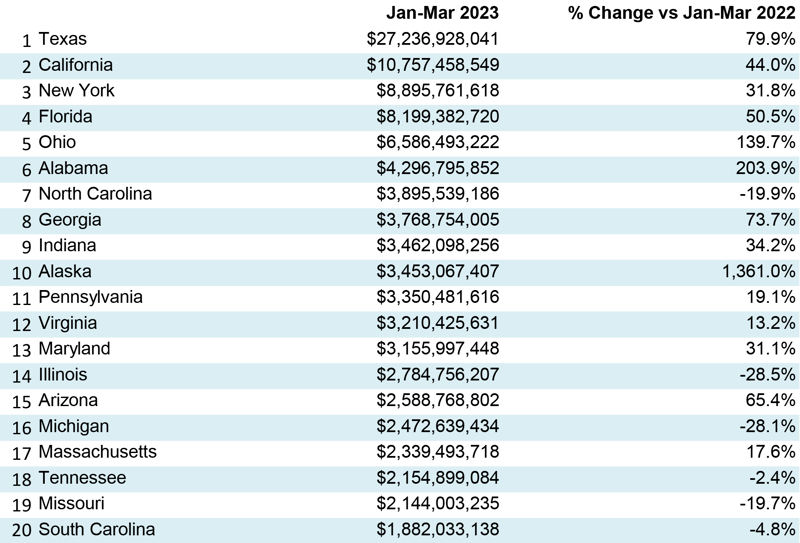
Table 4: 2023 YTD Ranking of Top 20 States by $ Volume of Nonresidential Building Construction Starts — ConstructConnect®
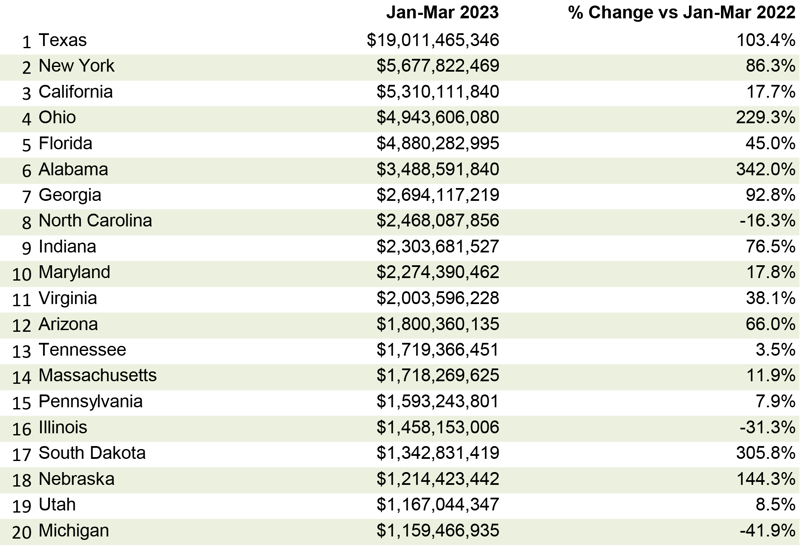
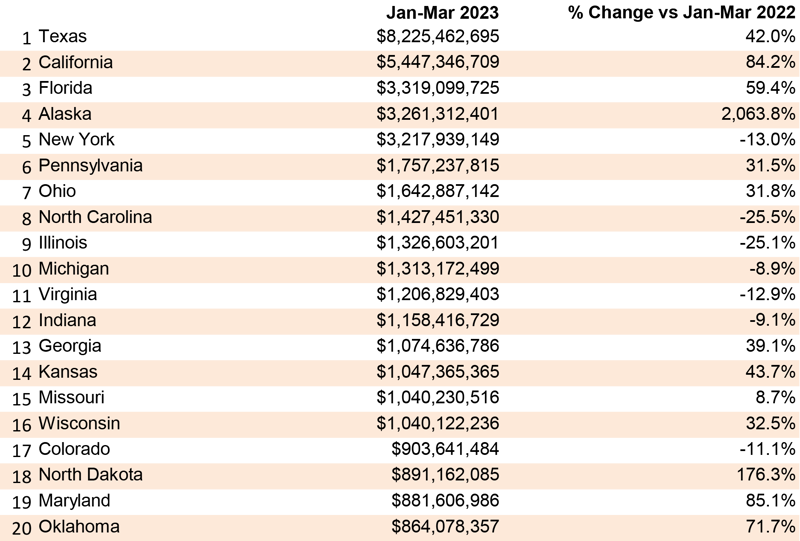
Table 5: 2023 YTD Ranking of Top 20 States by $ Volume of Heavy Engineering/Civil Construction Starts — ConstructConnect®
March 2023’s y/y results for three building-related BLS Producer Price Index series were: (A) construction materials special index, -4.0% (little changed from February’s -3.9%); (B) inputs to new construction index, excluding capital investment, labor, and imports, -3.8% (a significant drop from the previous month’s +0.7%); and (C) final demand construction, designed to capture bid prices, +15.6% (a minor moderation from +16.1% in the period prior).
(A) comes from a data series with a long history, but it’s confined to a limited number of major construction materials. (B) has a shorter history, but it’s more comprehensive in its coverage, although it includes some items (e.g., transportation) that aren’t strictly materials.
There are also PPI indices for specific construction inputs. There are only a few materials currently showing y/y price increases: cement, +17.0%; ready-mix concrete, +13.2%; and gypsum products, +9.9%. There are far more items with negative y/y price performances: softwood lumber, -49.3%; asphalt, -23.4%; diesel fuel, -19.4%; aluminum mill shapes, -13.0%; hot rolled steel bars, plates, and structural shapes, -8.9%; and copper wire and cable, -2.7%. Also, there’s an inputs to highways and streets index, -0.1%.
The value of construction starts each month is derived from ConstructConnect’s database of all active construction projects in the U.S. ConstructConnect’s nonresidential construction starts series, because it is comprised of total-value estimates for individual projects, some of which are super-large, has a history of being more volatile than many other leading indicators for the economy.
, ConstructConnect’s total residential starts in March 2023 were +23.8% m/m, -30.0% y/y, and -29.5% YTD. Multi-family starts were +26.4% m/m, -22.2% y/y, and -19.1% YTD. Single-family starts were +22.4 m/m, -33.6% y/y, and -34.6% YTD. The reader will notice that the slide in residential starts took a pause in March. The month-to-month changes were consistently on the upside.
Including home building with all nonresidential categories, Grand Total starts in March 2023 were +37.3% m/m, -0.4% y/y, and +5.0% YTD.
ConstructConnect adopts a research-assigned start date. In concept, a start is equivalent to ground being broken for a project to proceed. If work is abandoned or rebid, the start date is revised to reflect the new information.
The first two weeks of April saw a stream of mixed economic signals. Among the positives was a 5.0% U.S. inflation rate, the lowest in two years, and a hopeful sign that supply and demand are nearer a balance than they have been since mid-2020.
Furthermore, the U.S. producer price index for construction material prices contracted in its latest reading, due to improved supply chain conditions over the last five months, as reported by the Kansas City Federal Reserve.
Unfortunately, other signals continue to cast a shadow, the most significant of which may have come from the Federal Reserve in its latest meeting minutes released to the public on April 12, 2023. In those minutes, the Fed implied that the recent fallout from the banking crisis would likely push the economy into a recession sometime before 2024.
Other financial measures of the economy also continue to flash warning signs. Business loans remain historically expensive, which suppresses investments and purchases. Also, OPEC has made a surprise cut to oil production, lifting global prices and raising costs for families and businesses.
It is no wonder then that various market watchers have been warning of a forthcoming recession, to say nothing about the specifics of where the construction economy is headed. For this reason, ConstructConnect is leaning on its comprehensive database of historic and forthcoming projects to quantify construction project stress and, by extension, the health of the industry.
Through early April 2023, our data suggest that the level of projects experiencing delayed bid dates remains well within cyclical norms. More interesting, though, is the modest decline in the recent level of projects that are on hold, concurrent with a mild elevation in the level of abandoned projects.
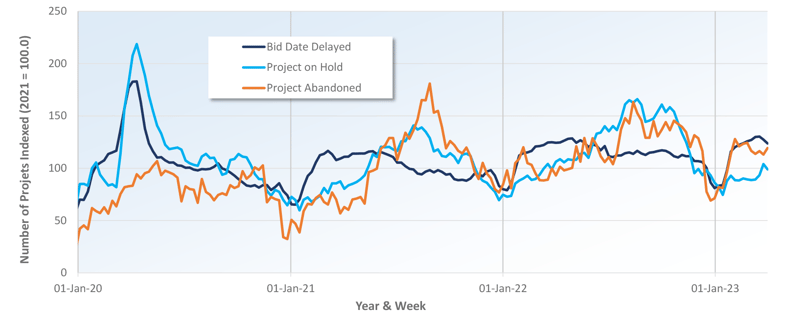
While the database has a relatively short history, one theory being tested presently is that the on-hold and abandoned levels move closely together unless a market correction is underway or is about to occur. In a market downturn, the level of abandoned projects would rise at the expense of the level of projects which are placed on hold or delayed.
ConstructConnect will continue to monitor each of these stress indicators and their relative behaviors as we seek to separate general market volatility from true signals of a market change. - Michael Guckes, Senior Economist
A rule of thumb is that nonresidential construction is a lagging indicator among economic measures. Companies are hesitant to undertake capital spending until their personnel needs are rapidly expanding and their office square footage or plant footprints are straining capacity. Plus, it helps if profits are abundant.
The rule doesn’t always hold true, however. For example, under present circumstances, weakness in some (mainly cyclical) areas of construction investment may well be offset by rich veins of large industrial and engineering projects to be unearthed.
Each month, ConstructConnect publishes information on upcoming construction projects at its Expansion Index.
The Expansion Index, for hundreds of cities in the United States and Canada, calculates the ratio, based on dollar volume, of projects in the planning stage, at present, divided by the comparable figure a year ago. The ratio moves above 1.0 when there is currently a larger dollar volume of construction prospects than there was last year at the same time. The ratio sinks below 1.0 when the opposite is the case. The results are set out in interactive maps for both countries.
Click here to download the Construction Industry Snapshot Package - April 2023 PDF.
Click here for the Top 10 Project Starts in the U.S. - March 2023.
Click here for the Nonresidential Construction Starts Trend Graphs - March 2023.
ConstructConnect's May 2023 volume of nonresidential construction starts was $49.2 billion, up +4.3% versus April 2023’s figure of $47.1 billion
ConstructConnect's March 2023 volume of nonresidential construction starts was $47.6 billion, an increase of +45.0% versus February 2023.
ConstructConnect announced June 2023’s volume of nonresidential construction starts was $63.2 billion, up +25.5% versus May 2023’s $50.3 billion.
ConstructConnect announced today that February 2023’s volume of construction starts, excluding residential work, was $33.0 billion.