March’s Nonresidential Construction Starts +45% M/M, +26% Y/Y, and +36% YTD
ConstructConnect's March 2023 volume of nonresidential construction starts was $47.6 billion, an increase of +45.0% versus February 2023.

ConstructConnect announced today that April 2023’s volume of construction starts, excluding residential work, was $47.0 billion, a decrease of -2.1% versus March 2023’s figure of $48.0 billion (originally reported as $47.6 billion).
While April 2023’s nonresidential total took only a small step back on a month-to-month basis, it undertook a more significant retreat relative to April of last year. On a year-over-year basis, the decline was -20.4%. April of this year was aided by go-aheads for two mega-sized projects with a combined estimated value of $3.8 billion, but that was a far cry from the four nonresidential megaprojects that broke ground in April 2022 for a summed value of $14.4 billion.
/industry-snapshot_April_2023.jpg)
Click here to download the complete Construction Industry Snapshot Package - May 2023 PDF.
April 2023’s two megaprojects were an EV battery plant for Stellantis and Samsung in Indiana and a new marine lock in Sault Sainte Marie, Michigan, being built by the Army Corp of Engineers. The largest project initiation in April of last year was an LNG exporting facility in Louisiana for $10.0 billion. Comparing both months when their ultra-large projects are set aside reveals that April 2023’s total nonresidential starts were only -3.4% relative to April 2022.
Last year’s exceptional strength in megaproject starts will continue to give a downward bias to year-over-year comparisons in the coming months. For example, this will be seen again a month from now, since May 2022 harbored four mega projects for $20.0 billion. Worth noting, though, is that there are still large projects on the scene, even if they don’t quite measure up to the billion-dollar megaproject benchmark. The lowest estimated value for the projects appearing in May 2023’s Top 10 list (Table 7) is $450 million, a figure not to be taken lightly.
On a year-to-date basis, the latest months’ total nonresidential starts were +15.6% compared with January to April of last year. (Q1 this year had more megas than Q1 last year.)
To complete the overview picture, the GRAND TOTAL dollar volume (i.e., adding residential to nonresidential activity) of starts in April 2023 was -5.7% m/m, -30.2% y/y, and -5.7% YTD. Residential starts, in particular, have been pulling the Grand Total down year to date.
Other statistics often beloved by analysts are trailing twelve-month results and these are set out for all the various type-of-structure categories in Table 9 of this report.
Grand Total TTM starts in April, on a month-to-month basis, were -3.1%, backtracking from +0.1% in March, and straying further off the path from February, -0.5%.
On a year-over-year basis, Grand Total TTM starts in April remained ahead by a double-digit percentage change, +11.4%, but they lost sparkle compared with March’s +19.1% and February’s +19.3%.
Starts compile the total estimated dollar value and square footage of all projects on which ground is broken in any given month. They lead, by nine months to as much as two years, put-in-place statistics from the Census Bureau, which are analogous to work-in-progress payments as the building of structures proceeds to completion.
PIP numbers cover the universe of construction, new plus all manner of renovation activity, with residential traditionally (i.e., over the decade preceding the pandemic) making up two-fifths (about 40%) of the total, and nonresidential, three-fifths (i.e., the bigger portion, at around 60%).
In 2021 and 2022, there were dramatic changes in the proportional shares of the total put-in-place dollar volumes taken by residential versus nonresidential. In 2021’s full-year PIP results, the relationship was about half and half, with residential at 49.4% and nonresidential, at 50.6%. In 2022, residential finally succeeded in claiming the larger share of the total, 50.7% to 49.4% for nonresidential.
This altered relationship, given the boosts to interest rates, could not be expected to last. Higher interest rates, which harm affordability, have an almost immediate negative impact on housing demand. True to historical form, residential’s year-to-date share of total PIP dollars through March of this year has retreated to 45.6%. (Through March of last year, its share was 52.2%.)
The reported PIP numbers from the Census Bureau are always a month behind the starts data. The total dollar volume of construction put-in-place through March of this year has been +4.3%, with residential singing a sad song at -8.8%, and nonresidential chirping merrily, at +18.6%.
Nonresidential’s leading subsector for year-to-date percentage change (2023/2022) has been manufacturing, +57.5%. Lodging has also experienced an outsized jump, +38.8%. Commercial (which is largely retail), highway and street, water delivery and treatment, and conservation and development have all managed year-to-date climbs of one-fifth (+20%) or more.
PIP numbers, being more spread out, have smaller peak-over-trough percent-change amplitudes than the starts series. As an additional valuable service for clients and powered by its extensive starts database, ConstructConnect, in partnership with Oxford Economics, a world leader in econometric modeling, has developed put-in-place construction statistics by types of structure for U.S. states, cities, and counties, actuals and forecasts. ConstructConnect’s PIP numbers are released quarterly and are featured in a separate reporting system.
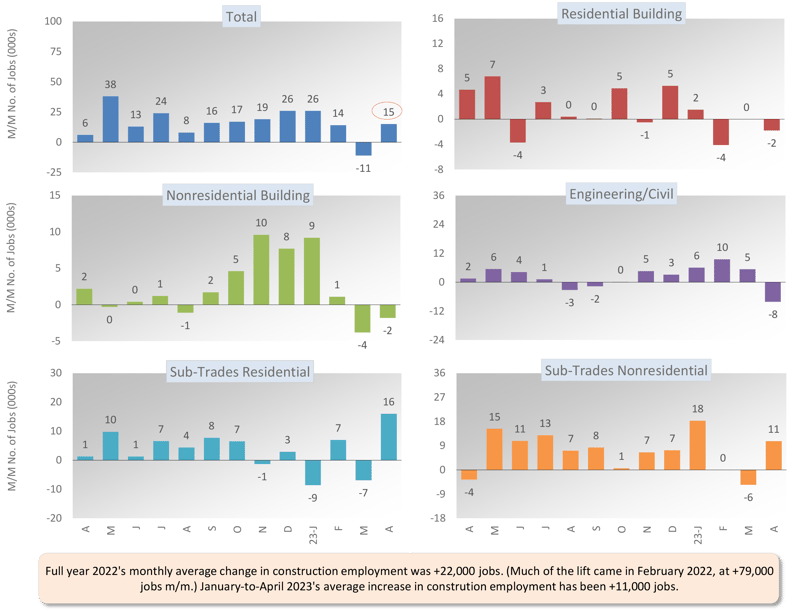
Construction’s share of U.S. total nonfarm employment in the monthly labor market report issued by the Bureau of Labor Statistics is slightly more than 5.0%. Accordingly, to claim its rightful portion of April’s +253,000 economy-wide number-of-jobs advance, the figure for construction would have needed to be +13,000. Impressively, that target was beaten by an actual figure of +15,000. Additional staffing at the subcontractor level accounted for the strength. Graph 1 shows subcontractors on residential work adding +16,000 workers; on nonresidential, +11,000.
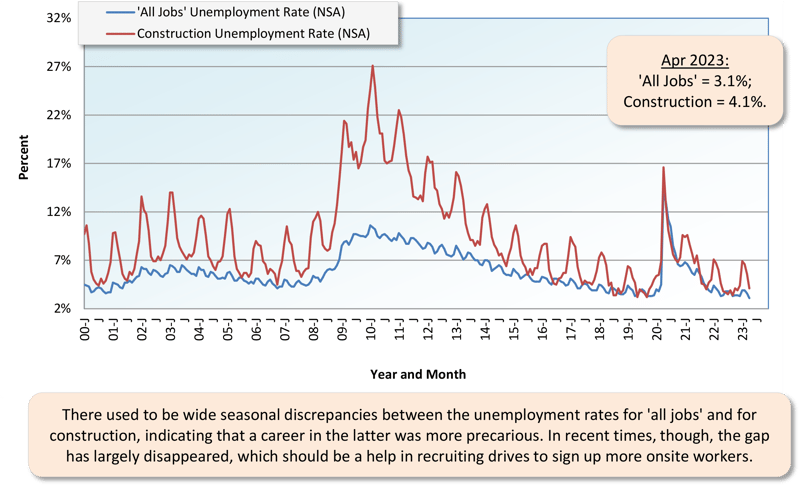
Construction’s not seasonally adjusted unemployment rate in April was 4.1%, down considerably from March’s 5.6%, and a half percentage point under year-ago April’s 4.6%. With spring underway, seasonality (i.e., more activity due to warmer weather) is now working to put a check on construction’s unemployment rate (see the seasonal pattern in Graph 3.)
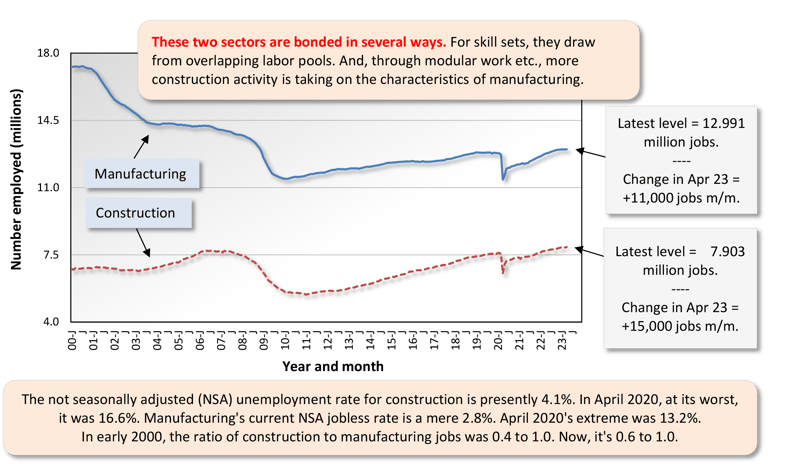
April’s NSA U rate for construction of 4.1% was higher than the nation’s all jobs figure of 3.1%. It also exceeded manufacturing’s 2.8%. Both the manufacturing and construction sectors are in the goods-producing segment of the economy (as opposed to private services-providing) and there is considerable overlap between their labor pools. Manufacturing’s performance with respect to jobs creation in April was +11,000 jobs.
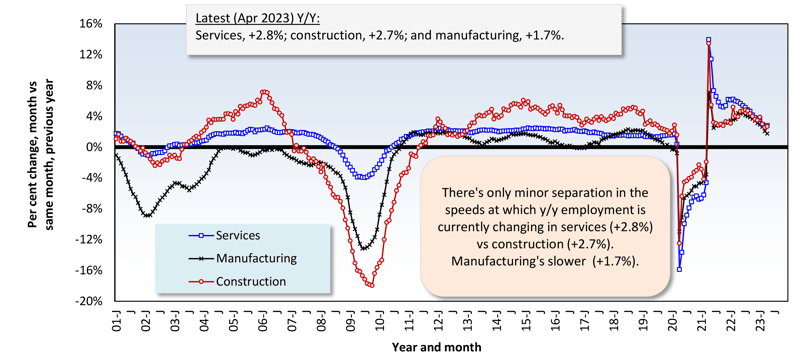
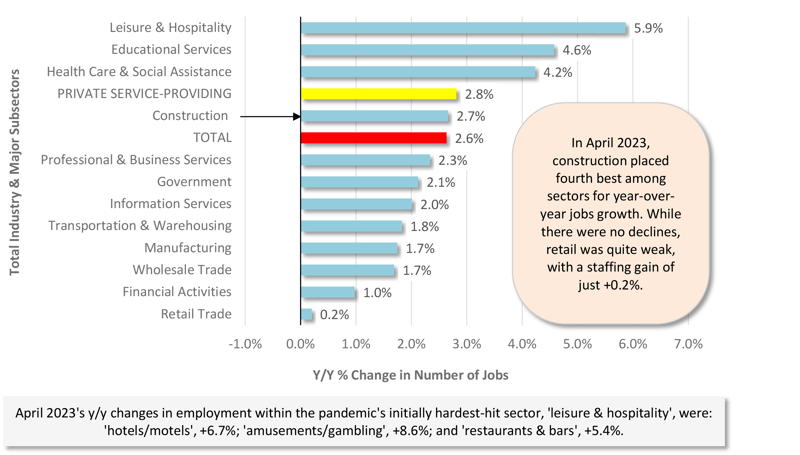
In April, U.S. total employment was +2.6% year over year. Private services-providing employment was ahead by a little more, +2.8% y/y. Construction’s jobs count was +2.7% y/y, and manufacturing’s, was +1.7% y/y. Setting the fastest year-over-year pace for jobs growth among all industrial sectors was leisure and hospitality, +5.9%.
In other segments of the economy with close ties to construction, the latest y/y percentage changes in employment were as follows: architectural and engineering design services, +5.1%; cement and concrete product manufacturing, +4.6%; machinery and equipment rental and leasing, +3.6%; real estate, +2.6%; oil and gas exploration and development, -1.5%; and building materials and supplies dealers, -4.2%. The latter is the fallout from lackluster housing starts.
Design services work at architectural and engineering firms is a vital early-stage cog in the entire construction process that eventually leads to activity in the field. Therefore, the +5.1% y/y gain for jobs in the sector sends an upbeat message. Also worth mentioning is that the latest Architecture Billings Index from the American Institute of Architects took an encouraging turn. After sitting below 50.0 for five months in a row, it shifted higher to 50.4 in March. Below 50.0, revenues for design firms are shrinking; above it, they’re expanding.
Graph 1: Change in Level of U.S. Construction Employment, Month to Month (M/M) − Total & by Categories - April 2023
Graph 2: U.S. Manufacturing Versus Construction Employment - April 2023 - Seasonally Adjusted Payroll Data
Graph 3: U.S. Unemployment Rates: All Jobs & Construction - April 2023 (Not Seasonally Adjusted)
Graph 4: U.S. Employment - April 2023 - % Change Y/Y (Seasonally Adjusted)
Graph 5: U.S. Total & Subsectors Y/Y Jobs Change - April 2023 (Seasonally Adjusted)
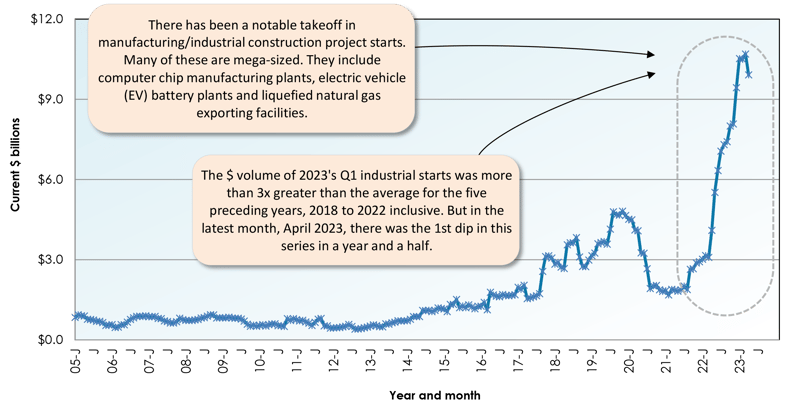
Graph 6: U.S. Manufacturing Construction Starts - ConstructConnect (12-Month Moving Averages)
The -2.1% month-to-month (m/m) dip in the dollar volume of April’s total nonresidential starts resulted from drops in industrial (-17.9%) and institutional (-13.4%) that that were not quite counterbalanced by gains in commercial (+4.9%) and engineering (+4.2%) that almost matched.
The -20.4% contraction in total nonresidential starts in April 2023 versus April 2022 (y/y) was caused by a sharp pullback in industrial work (-69.9%), along with less severe minuses in commercial (-30.4%) and institutional (-20.3%), while engineering scored a pickup (+20.7%).
On a year-to-date basis through the first four months of 2023, total nonresidential starts were ahead of 2022’s January-April comparable dollar volume figure by +15.6%. A decline in the commercial subcategory (-10.3%) was more than offset by sizable bumps in heavy engineering (+27.2%), industrial (+26.8%), and institutional (+17.8%).
Graph 6 shines a spotlight on the remarkable manner in which manufacturing (a.k.a. industrial) construction starts have behaved over the past year and a half. On a 12-month moving average basis, they ascended with a rapidity and to a height never seen before. In April of this year, however, the previously soaring curve finally lost steam, and a setback was recorded.
Usually, about a third of all nonresidential starts derive from just two subcategory type-of-structure designations, roads/highways and schools/colleges. Through the first four months of 2023, their shares of the total have been 18.6% and 13.4%, respectively, adding to 32.0%.
The three percentage-change metrics for street starts in April were +15.7% m/m, +19.9% y/y, and +24.6% YTD. For school starts, the results in the latest month were -17.9% m/m and -23.4% y/y, but +9.8% YTD. Further, with respect to educational facility starts, junior and senior high schools have set the hottest year-to-date percentage change pace, +18.3%.
Important beyond roads within the engineering subcategory are water/sewage and bridge starts. The results for the former in April were +9.2% m/m, +31.1% y/y, and +22.7% YTD. For the latter, they were +10.3% m/m, -24.6% y/y, and +1.3% YTD.
April’s three metrics for miscellaneous civil starts, a designation which includes power and railroad components, were -63.8% m/m and -22.4% y/y, but an impressive +40.1% YTD.
Important beyond schools in institutional are three medical subcategories, i.e., hospitals/clinics, nursing/assisted living, and miscellaneous medical. Their combined starts in April were +40.0% m/m, +8.6% y/y, and +21.9% YTD. The dollar volume of hospital project starts on their own year-to-date has been +61.0%.
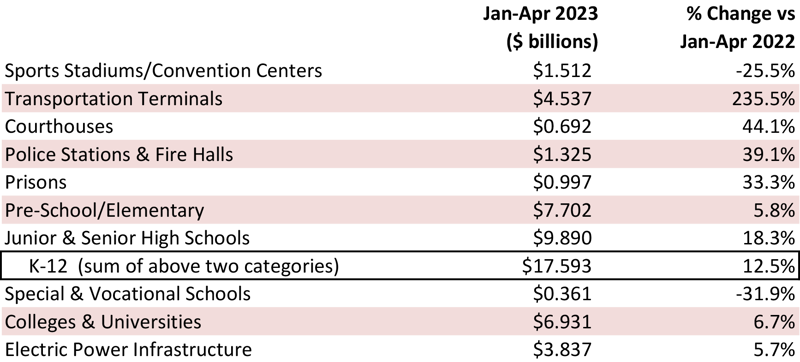
Among commercial subcategories in April, only amusement (+48.3%), government offices (+35.8%), and miscellaneous (+78.8%) have shown positive movement year to date in 2023. Transportation terminal starts (Table 2) within miscellaneous are +235.5%, thanks to final phase work at Denver’s International Airport.
Groundbreakings on warehouses (-48.8%), private office buildings (-38.7%), and retail/shopping projects (-15.8%) have all failed to make headway to date in 2023.
Table 2: Construction Starts in Some Additional Type of Structure Subcategories
The declines in position offerings and sign-ups from the Jobs Openings and Labor Turnover Survey report are more clearly apparent for all jobs than for construction work. Nonetheless, and as is shown in Graphs 7 and 8, moderation in the openings and hires levels and rates is creeping into the construction sector as well. Openings are displaying volatility while edging lower. Hires have dropped to a slightly lower plain and are crawling sideways.
This Industry Snapshot sets out the history, from January 2005 to the present, of 12-month moving ConstructConnect starts averages for a dozen construction types of structures. The moving-average approach is designed to capture trends. (As a technical note, the moving average is graphed at the ending month.)
Graph 11 delivers the key takeaway. The heavy engineering trend line is continuing to show an upwards slant. The nonresidential buildings trend line, though, now features a downward bend at its end. The fault line runs mainly through commercial starts, with neither private office buildings nor retail being able to provide much support. Within engineering, the trend line slopes for roads/highways, water/sewage, and miscellaneous are all ticking up in fine fashion.
Tables B-3 and B-8 of the monthly Employment Situation report, from the BLS, record average hourly and average weekly wages for industry sectors. B-3 is for all employees (i.e., including bosses) on nonfarm payrolls. B-8 is for production and nonsupervisory personnel only (i.e., it excludes bosses). For all jobs and construction, there are eight relevant percentage changes to follow.
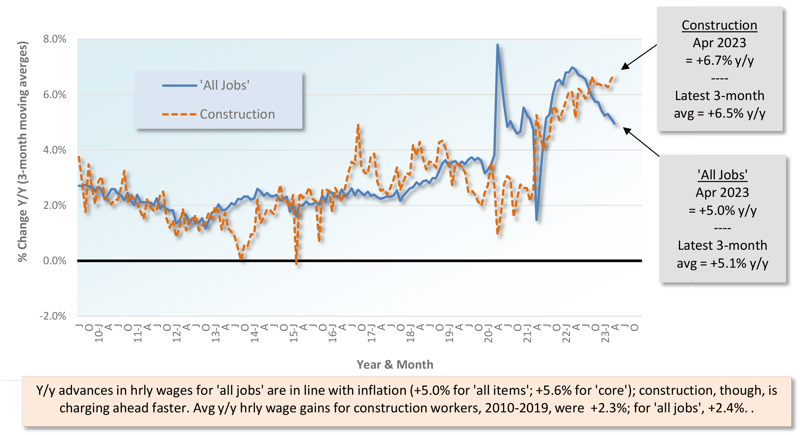
From April 2023’s Table B-3 (including bosses), y/y all-jobs earnings were +4.4% hourly and +3.8% weekly. Compensation hikes for construction workers, as a subset of all jobs, were better at +5.4% hourly and +6.0% weekly. From Table B-8 for production and nonsupervisory workers (i.e., excluding bosses), the y/y all-jobs paycheck advances were +5.0% hourly and +4.0% weekly. Once again, though, construction workers were justified in having ear-to-ear grins. Their wallets and purses swelled to the tune of +6.7% hourly and +7.0% weekly.
It’s good news that purchasing power, which looks at wage gains versus inflation, is now being maintained since the y/y increase in CPI-U has fallen to hover around +5.0%.
Graph 9: Average Hourly Earnings Y/Y - All Jobs & Construction
Graph 10: Average Weekly Earnings Y/Y - All Jobs & Construction
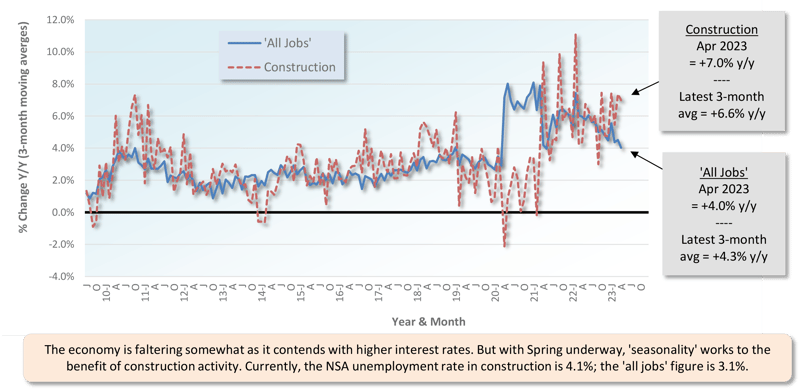
Table 3: 2023 YTD Ranking of Top 20 States by $ Volume of Nonresidential Construction Starts — ConstructConnect®
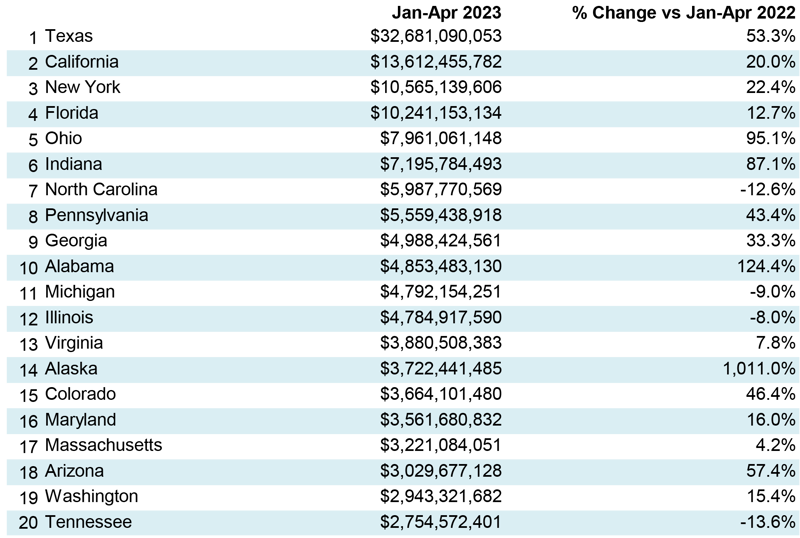
Table 4: 2023 YTD Ranking of Top 20 States by $ Volume of Nonresidential Building Construction Starts — ConstructConnect®
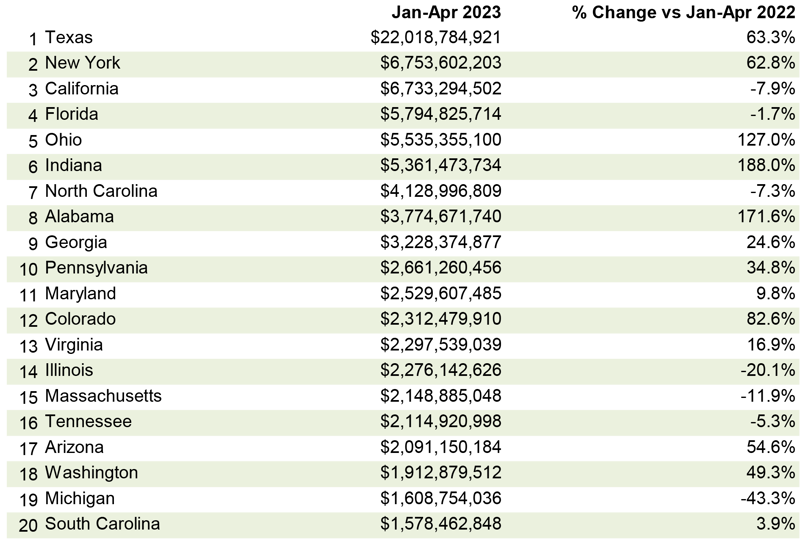
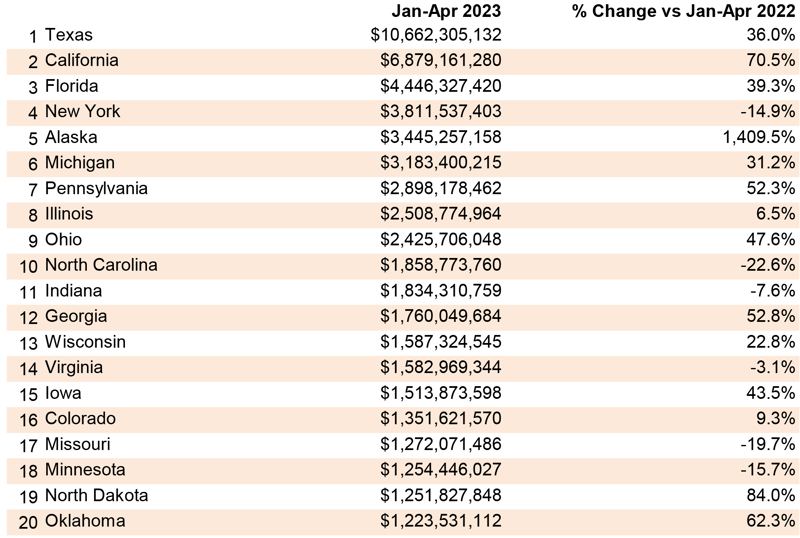
Table 5: 2023 YTD Ranking of Top 20 States by $ Volume of Heavy Engineering/Civil Construction Starts — ConstructConnect®
April 2023’s y/y results for three building-related BLS Producer Price Index series were: (A) construction materials special index, -2.9% (less negative than March’s -4.0%); (B) inputs to new construction index, excluding capital investment, labor, and imports, -3.4% (hardly deviating from the previous month’s -3.3%); and (C) final demand construction, designed to capture bid prices, +11.2% (a noteworthy downgrade from the prior period’s +15.6%).
(A) comes from a data series with a long history, but it’s confined to a limited number of major construction materials. (B) has a shorter history, but it’s more comprehensive in its coverage, although it includes some items (e.g., transportation) that aren’t strictly materials.
There are also PPI indices for specific construction inputs. There are only a few materials currently showing y/y price increases: cement, +13.7%; ready-mix concrete, +12.5%; and gypsum products, +10.2%. There are far more items with negative y/y price performances: softwood lumber, -38.9%; diesel fuel, -27.1%; asphalt, -23.8%; aluminum mill shapes, -18.1%; hot rolled steel bars, plates, and structural shapes, -7.9%; and copper wire and cable, -5.8%. Also, there’s an ‘inputs to highways and streets’ index, -0.2%.
The value of construction starts each month is derived from ConstructConnect’s database of all active construction projects in the U.S. ConstructConnect’s nonresidential construction starts series, because it is comprised of total-value estimates for individual projects, some of which are super-large, has a history of being more volatile than many other leading indicators for the economy.
ConstructConnect’s total residential starts in April 2023 were -12.8% m/m, -45.1% y/y, and -32.4% YTD. Multifamily starts were -46.2% m/m, -65.8% y/y, and -30.5% YTD. Single-family starts were +6.3 m/m, -33.4% y/y, and -33.4% YTD.
Including home building with all nonresidential categories, Grand Total starts in April 2023 were -5.7% m/m, -30.2% y/y, and -5.7% YTD (not a typo; m/m and YTD the same at -5.7%).
ConstructConnect adopts a research-assigned start date. In concept, a start is equivalent to ground being broken for a project to proceed. If work is abandoned or rebid, the start date is revised to reflect the new information.
Following in the footsteps of the unprecedented materials and labor challenges of 2020-2022, it is now evident in 2023 that businesses will face a fresh wave of extraordinary capital challenges stemming from the delayed effects of various COVID-19-related fiscal and monetary measures. As central banks such as the Federal Reserve in the United States and the Bank of Canada gradually increased interest rates from 2022 onward to control inflation, unintended consequences emerged, including the diminishing present value of banks’ outstanding loans accumulated since 2010.
Consequently, banks currently hold significant amounts of loans that, if sold today, are worth less than their original face value, or par value. In this scenario, the most prudent course of action for banks may be to wait, collect principal and interest on these subpar loans, and redirect that capital into today’s higher interest rate environment.
However, this wait-and-see approach is not always feasible, as banks may be compelled to raise capital to fulfill regulatory requirements or cover losses from bad loans. While selling subpar loans can generate cash to cover capital requirements, it also forces banks to recognize losses on these loans, akin to how shareholders recognize losses only upon selling their shares. Consequently, banks have become more cautious about lending to the construction industry.
During the height of the Great Recession, nearly a quarter of all real estate construction and development borrowers failed to meet their obligations. In response, beginning in late 2008, banks scaled back their overall level of loans in the commercial real estate sector. It would not be until early 2016 that CRE loan levels would once again reach their prerecession levels.
Currently, banks are confronted with an economy that faces the risk of recession, low office occupancy rates, and declining asset prices for vehicles and homes. These factors provide compelling reasons for banks to exercise extreme caution in extending capital to borrowers.
When combined with the underlying risk of selling old loans at a loss, it becomes evident why lending standards have tightened and why capital management and capital access will be the growing focus of construction managers for the foreseeable future. Business leaders will need to be just as creative in solving their forthcoming capital challenges as they were in solving their material and labor problems. - Michael Guckes, Senior Economist
A rule of thumb is that nonresidential construction is a lagging indicator among economic measures. Companies are hesitant to undertake capital spending until their personnel needs are rapidly expanding and their office square footage or plant footprints are straining capacity. Plus, it helps if profits are abundant.
The rule doesn’t always hold true, however. For example, under present circumstances, weakness in some (mainly cyclical) areas of construction investment may well be offset by rich veins of large industrial and engineering projects.
Each month, ConstructConnect publishes information on upcoming construction projects at its Expansion Index.
The Expansion Index, for hundreds of cities in the United States and Canada, calculates the ratio, based on dollar volume, of projects in the planning stage, at present, divided by the comparable figure a year ago. The ratio moves above 1.0 when there is currently a larger dollar volume of construction prospects than there was last year at the same time. The ratio sinks below 1.0 when the opposite is the case. The results are set out in interactive maps for both countries.
Click here to download the Construction Industry Snapshot Package - May 2023 PDF.
Click here for the Top 10 Project Starts in the U.S. - April 2023.
Click here for the Nonresidential Construction Starts Trend Graphs - April 2023.
ConstructConnect's March 2023 volume of nonresidential construction starts was $47.6 billion, an increase of +45.0% versus February 2023.
ConstructConnect's May 2023 volume of nonresidential construction starts was $49.2 billion, up +4.3% versus April 2023’s figure of $47.1 billion
ConstructConnect Releases April 2024 Nonresidential Construction Starts
ConstructConnect leading provider of software solutions for preconstruction industry announced US construction to grow at 4.5% in Spring 2024...