March’s Nonresidential Construction Starts +45% M/M, +26% Y/Y, and +36% YTD
ConstructConnect's March 2023 volume of nonresidential construction starts was $47.6 billion, an increase of +45.0% versus February 2023.

ConstructConnect announced today that May 2023’s volume of construction starts, excluding residential work, was $49.2 billion, an increase of +4.3% versus April 2023’s figure of $47.1 billion (originally reported as $47.0 billion).
The month-to-month improvement was a normal occurrence, given the seasonality that leads to more on-site work as spring and summer weather conditions become more accommodating. Where there was a shock in the latest nonresidential starts statistics, however, was in the comparison with May of last year, -30.1%. Most of the decline came in the realm of mega-sized projects (i.e., those projects carrying an estimated value of a billion dollars or more each.)
Click here to download the complete Construction Industry Snapshot Package - May 2023 PDF.
In Q1, Q2, and Q3 of last year, there was an unprecedented wealth of groundbreaking on megaprojects. The month with the largest dollar volume of megas in 2022 was May. In May 2022, there were four super-large projects with a combined value of $20.0 billion, with the biggest individual project being a semiconductor wafer fabrication complex in Texas. While May of the current year had two mega project start-ups, they fell short of the tally in last year’s same month.
May 2023’s two megaprojects were an EV battery plant in Kansas and a giant logistics center/warehouse in Arizona, adding to $4.5 billion. Comparing total nonresidential starts in May 2023 versus May 2022, setting aside mega projects, yields a decline of -11.3% rather than the -30.1% featured in the headline. That’s not as stark, but it’s still a splash of cooler water.
On a year-to-date basis, and including megas as well as non-megas, the latest month’s total nonresidential starts, were +2.2% compared with January to May of last year.
To complete the overview picture, the GRAND TOTAL dollar volume (i.e., adding residential to nonresidential activity) of starts in May 2023 was +1.5% m/m, -31.8% y/y, and -11.3% YTD. Residential starts (-30.7% YTD) have been a particular drag on Grand Total starts YTD.
Other statistics often beloved by analysts are trailing twelve-month results and these are set out for all the various type-of-structure categories in Table 9 of this report.
Grand Total TTM starts in May, on a month-to-month basis, were -3.5%, marking a further deterioration from -2.9% in April and veering further away from +0.2% in March.
On a year-over-year basis, Grand Total TTM starts in May stayed on the plus side of change, +4.2%, but they significantly decelerated from +12.8% in April and +20.3% in March.
Starts compile the total estimated dollar value and square footage of all projects on which ground is broken in any given month. They lead, by nine months to as much as two years, put-in-place statistics from the Census Bureau, which are analogous to work-in-progress payments as the building of structures proceeds to completion.
PIP numbers cover the universe of construction, new plus all manner of renovation activity, with residential traditionally (i.e., over the decade preceding the pandemic) making up two-fifths (about 40%) of the total, and nonresidential, three-fifths (i.e., the bigger portion, at around 60%).
In 2021 and 2022, there were dramatic changes in the proportional shares of the total put-in-place dollar volumes taken by residential versus nonresidential. In 2021’s full-year PIP results, the relationship was about half and half, with residential at 49.4% and nonresidential, at 50.6%. In 2022, residential finally succeeded in claiming the larger share of the total, 50.7% to 49.4% for nonresidential.
This altered relationship, given the boosts to interest rates, could not be expected to last. Higher interest rates, which harm affordability, have an almost immediate negative impact on housing demand. True to historical form, residential’s year-to-date share of total PIP dollars through April of this year has retreated to 45.4%. (Through April of last year, its share was 52.7%.)
The reported PIP numbers from the Census Bureau are always a month behind the starts data. The total dollar volume of construction put-in-place through April of this year has been +6.1%, with residential slinking off the stage, -8.4%, and nonresidential grabbing the spotlight, +22.3%.
Nonresidential construction’s leading PIP subcategory for year-to-date percentage change (2023/2022) has been manufacturing, a stunning +83.8%. (Also, by dollar volume YTD, ‘manufacturing’ has moved up to become the largest subcategory among the PIP nonresidentail stats.)
Returning to percentage changes YTD, lodging (+40.6%) holds the second spot after manufacturing. Also with stellar increases, ranging from a fifth (+20%) to a quarter (+25%), have been commercial (which is largely retail), highway and street, and water delivery and treatment.
PIP numbers, being more spread out, have smaller peak-over-trough percent-change amplitudes than the starts series. As an additional valuable service for clients and powered by its extensive starts database, ConstructConnect, in partnership with Oxford Economics, a world leader in econometric modeling, has developed put-in-place construction statistics by types of structure for U.S. states, cities, and counties, actuals and forecasts. ConstructConnect’s PIP numbers are released quarterly and are featured in a separate reporting system.
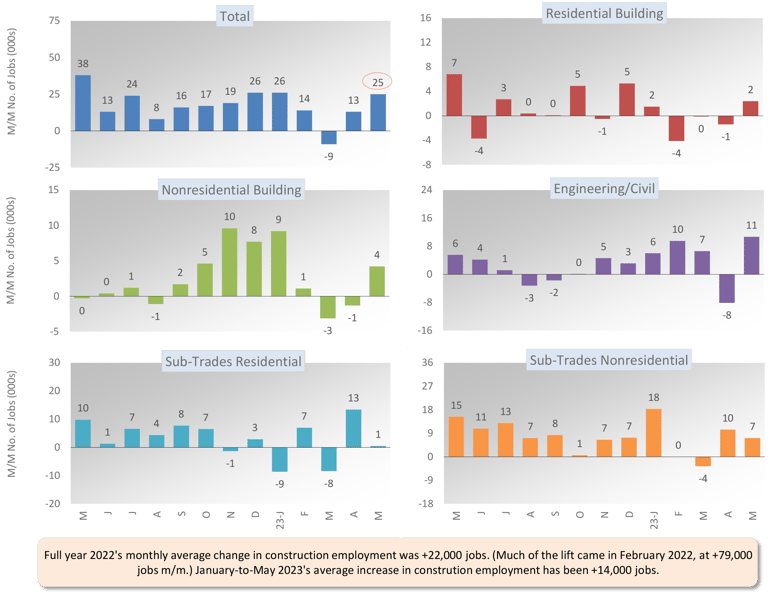
Construction’s share of U.S. total non-farm employment in the monthly labor market report issued by the Bureau of Labor Statistics is slightly more than 5.0%. Accordingly, to claim its rightful portion of May’s +339,000 economy-wide number-of-jobs advance, the figure for construction would have needed to be +17,000. Notably, that target was beaten by an actual figure of +25,000. Graph 1 shows that month-to-month hiring in May was most active among engineering/civil contractors (+11,000) and at the nonresidential subcontractor level (+7,000).
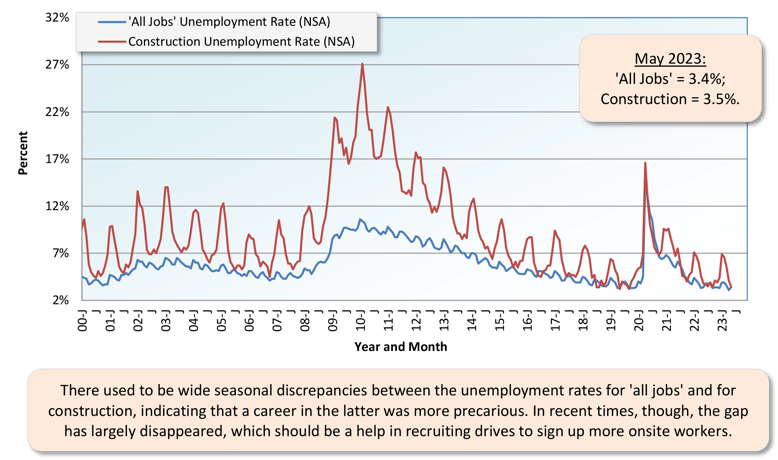
Construction’s not seasonally adjusted unemployment rate in May was 3.5%, down from April’s 4.1%, and also under May 2022’s 3.8%. Graph 3 shows the seasonality of construction’s unemployment rate. Note also, though, that it appears to be somewhat diminishing. The current 3.5% U rate for construction workers isn’t quite the lowest it has ever been. On a couple of occasions, most recently in September 2019, it bottomed at 3.2%.
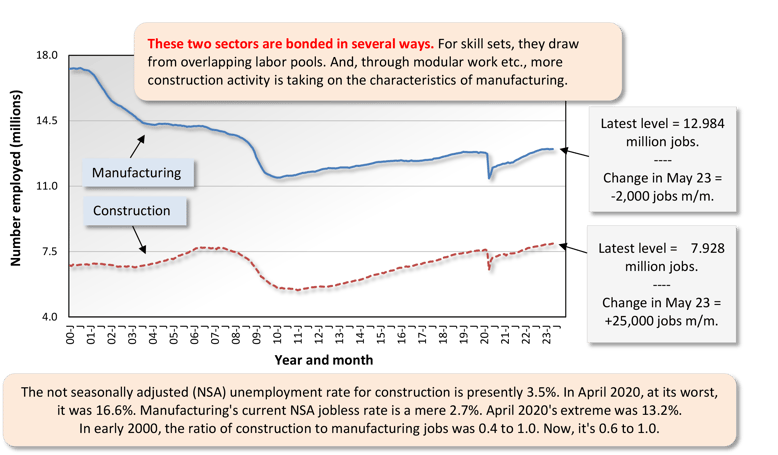
May’s NSA U rate for construction of 3.5% was only the smallest of notches above the nation’s ‘all jobs’ figure of 3.4%. It did, however, exceed manufacturing’s 2.7%. Both the manufacturing and construction sectors are in the goods-producing segment of the economy (i.e., as opposed to private services-providing), and there is considerable overlap between their labor pools. Staffing by manufacturers in May, though, took a step backward, -2,000 jobs (see Graph 2).
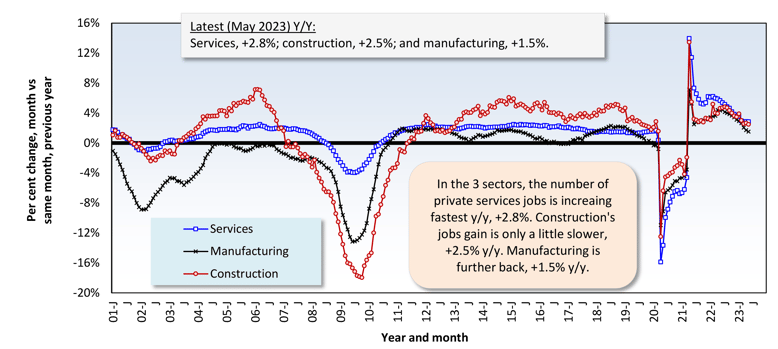
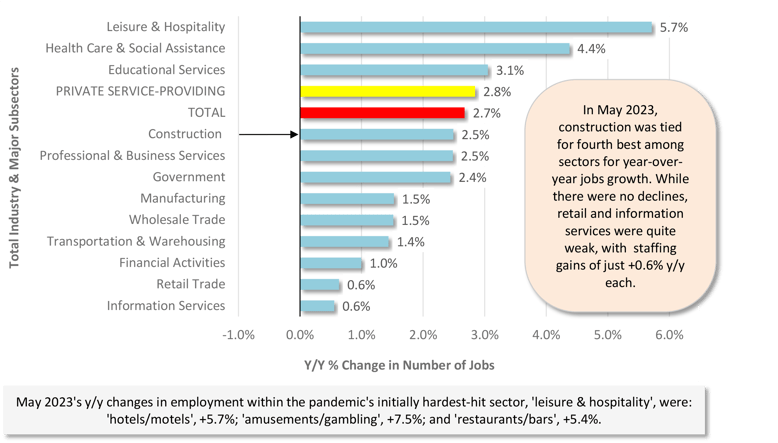
In May, U.S. total employment was +2.7% year over year. Private services-providing employment was ahead by a little more, +2.8% y/y. Construction’s jobs count was +2.5% y/y and manufacturing’s, +1.5% y/y. Setting the fastest year-over-year pace for jobs growth among all industrial sectors was leisure and hospitality, +5.7%.
In other segments of the economy with close ties to construction, the latest y/y changes in employment were as follows: architectural and engineering design services, +5.2%; cement and concrete product manufacturing, +4.8%; machinery and equipment rental and leasing, +3.3%; real estate, +2.3%; building materials and supplies dealers, +0.4% (after falling hard last year, housing starts have leveled off this year); and oil and gas exploration and development, -1.2%.
Design services work at architectural and engineering firms is a vital early-stage cog in the entire construction process that eventually leads to activity in the field. Consequently, the +5.2% y/y advance in the number of jobs in the sector is good news. But on the flip side, the latest Architecture Billings Index from the American Institute of Architects took an unwelcome turn. After climbing back above 50.0 in March, the ABI softened to 48.5 in April. (Below 50.0, revenues for design firms are shrinking; above it, they’re expanding.) The AIA does note, however, in its press release setting out the latest ABI reading that, despite a more difficult borrowing environment, inquiries into new projects are becoming livelier.
Graph 1: Change in Level of U.S. Construction Employment, Month to Month (M/M) − Total & by Categories - May 2023
Graph 2: U.S. Manufacturing Versus Construction Employment - May 2023 - Seasonally Adjusted Payroll Data
Graph 3: U.S. Unemployment Rates: All Jobs & Construction - May 2023 (Not Seasonally Adjusted)
Graph 4: U.S. Employment - May 2023 - % Change Y/Y (Seasonally Adjusted)
Graph 5: U.S. Total & Subsectors Y/Y Jobs Change - May 2023 (Seasonally Adjusted)
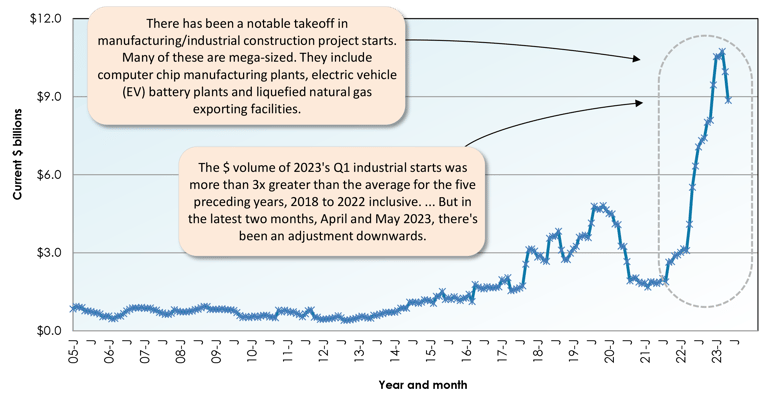
Graph 6: U.S. Manufacturing Construction Starts - ConstructConnect (12-Month Moving Averages)
The +4.3% month-to-month (m/m) forward motion in the dollar volume of May’s total nonresidential starts was the net result from retreats in the commercial (-10.9%) and heavy engineering/civil (-13.4%) type of structure subcategories being more than counterbalanced by onward rushes in the industrial (+45.8%) and institutional (+40.2%) sub-categories.
The -30.1% contraction in total nonresidential starts in May 2023 versus May 2022 (y/y) was due to a big fall-off in industrial work (-68.9%), a grim percent change in commercial (-37.0%), and some less severe shortcomings in institutional (-15.5%) and engineering (-2.6%).
On a year-to-date basis through the first five months of 2023, total nonresidential starts were ahead of 2022’s January-May comparable dollar volume figure by +2.2%. Declines in the industrial (-17.6%) and commercial (-15.3%) subcategories were a little more than offset by a sizable climb in heavy engineering (+19.7%) and a decent uptick in institutional (+7.4%).
Graph 6 shines a spotlight on the remarkable manner in which manufacturing (a.k.a. industrial) construction starts have behaved since mid-2021. On a 12-month moving average basis and driven by megaproject approvals, they ascended with a rapidity and to a height never seen before. In the past two months, however, the previously soaring curve has begun to retrace its steps. It’s now giving the appearance of returning from outer space to Earth’s atmosphere.
Usually, about a third of all nonresidential starts derive from just two subcategory type-of-structure designations, ‘roads/highways’ and schools/colleges. Through the first five months of 2023, their shares of the total have been 18.8% and 14.5%, respectively, adding to 33.3%.
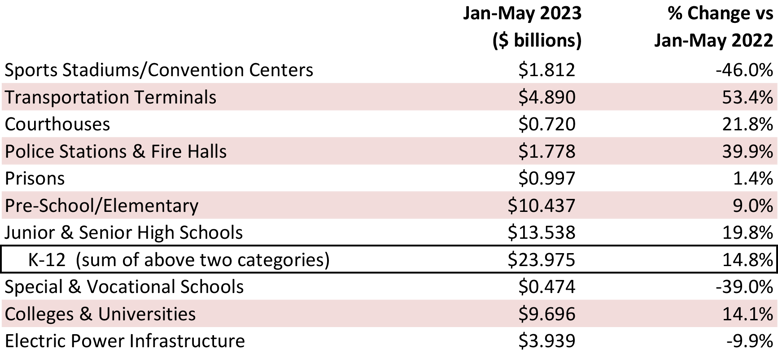
The three percentage-change metrics for street starts in May were -5.8% m/m, but +3.3% y/y, and +19.1% YTD. For school starts, the results in the latest month were +56.7% m/m, +23.6% y/y, and +13.2% YTD. Digging deeper into educational facility starts, junior and senior high schools (+19.8% YTD) and colleges and universities (+14.1% YTD) have done best (see Table 2).
Important beyond roads within the engineering subcategory are water/sewage and bridge starts. The results for the former in May were -1.0% m/m, but +1.9% y/y, and +17.1% YTD. For the latter, they were negative across the board, -15.0% m/m, -14.5% y/y, and -2.5% YTD.
May’s three metrics for miscellaneous civil starts, a designation which includes power and railroad components, were -20.1% m/m and -22.2% y/y, but a solid +28.7% YTD.
Important beyond schools within institutional work are three medical subcategories, i.e., hospitals/clinics, nursing/assisted living, and miscellaneous medical. Their combined starts in May were +18.2% m/m, but -60.6% y/y, and -14.2% YTD. Hospital starts on their own have been +113.8% m/m, -63.6% y/y, and -8.9% YTD.
Among commercial subcategories in May, only amusement (+40.8%), government offices (+33.8%), and transportation terminals (which are within miscellaneous commercial and are +53.4% YTD) have managed substantial year-to-date advances. Groundbreakings to date on private office buildings (-44.4%), warehouses (-34.8%), and retail/shopping (-19.9%) have been disappointing. Hotel/motel starts year to date are essentially flat (-2.0%).
Table 2: Construction Starts in Some Additional Type of Structure Subcategories
This Industry Snapshot sets out the history, from January 2005 to the present, of 12-month moving ConstructConnect starts averages for a dozen construction types of structures. The moving-average approach is designed to capture trends. (As a technical note, the moving average is graphed at the ending month.)
Consistent with the Federal Reserve’s moves to slow the economy, almost all the trend lines have taken a pause at their tops (e.g., schools/colleges) or are bending downwards. The only type-of-structure subcategories still emphatically climbing are roads/highways and water/sewage within engineering.
Tables B-3 and B-8 of the monthly Employment Situation report, from the BLS, record average hourly and average weekly wages for industry sectors. B-3 is for all employees (i.e., including bosses) on nonfarm payrolls. B-8 is for production and nonsupervisory personnel only (i.e., it excludes bosses). For all jobs and construction, there are eight relevant percentage changes to follow.
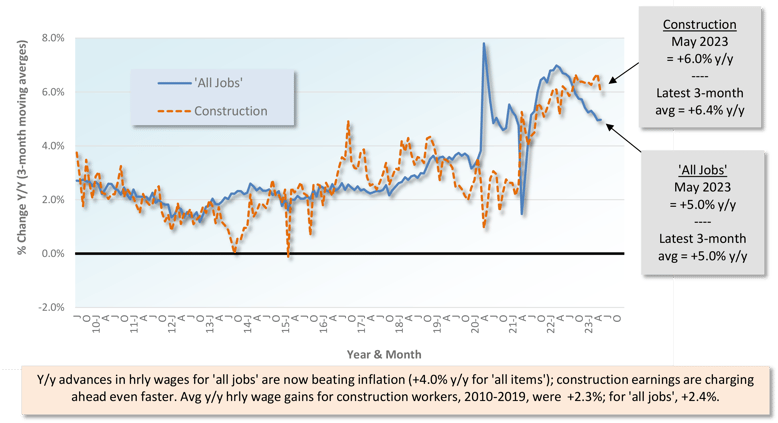
From May 2023’s Table B-3 (including bosses), y/y all-jobs earnings were +4.3% hourly and +3.4% weekly. Compensation hikes for construction workers, as a subset of ‘all jobs’, were better at +5.1% hourly and +4.8% weekly. From Table B-8 for production and non-supervisory workers (i.e., excluding bosses), the y/y ‘all-jobs’ paycheck advances were +5.0% hourly and +4.0% weekly. Once again, though, construction workers had more cause to kick up their heels, with an hourly increase of +6.0% y/y and a weekly stipend pickup of +5.2% y/y.
The latest CPI-U ‘all items’ inflation number has fallen back to +4.0% y/y. Comparing wage gains to inflation suggests that purchasing power, a key factor in the consumer spending that drives gross domestic product is no longer under duress but rather perking up.
Graph 9: Average Hourly Earnings Y/Y - All Jobs & Construction
Graph 10: Average Weekly Earnings Y/Y - All Jobs & Construction
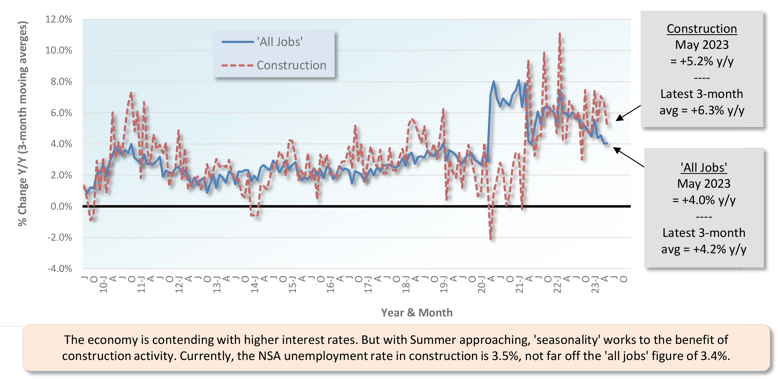
Table 3: 2023 YTD Ranking of Top 20 States by $ Volume of Nonresidential Construction Starts — ConstructConnect®
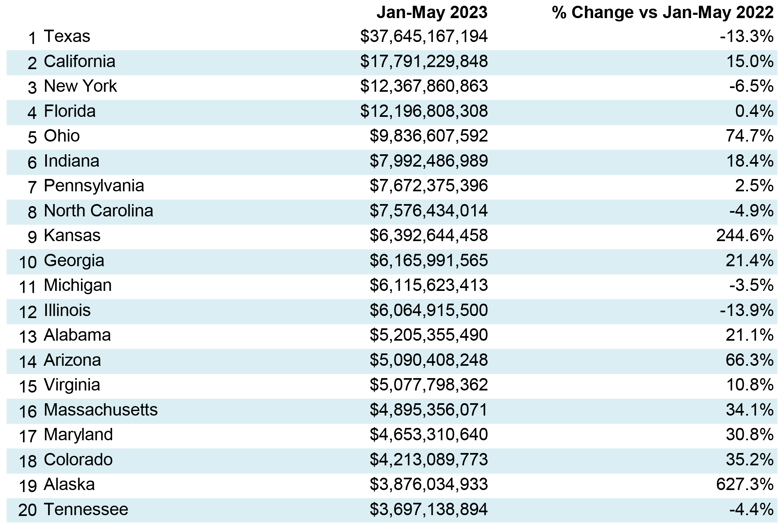
Table 4: 2023 YTD Ranking of Top 20 States by $ Volume of Nonresidential Building Construction Starts — ConstructConnect®
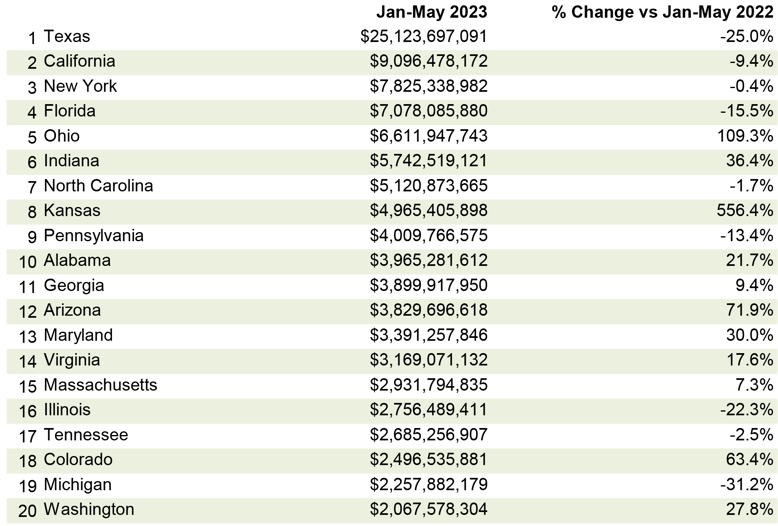
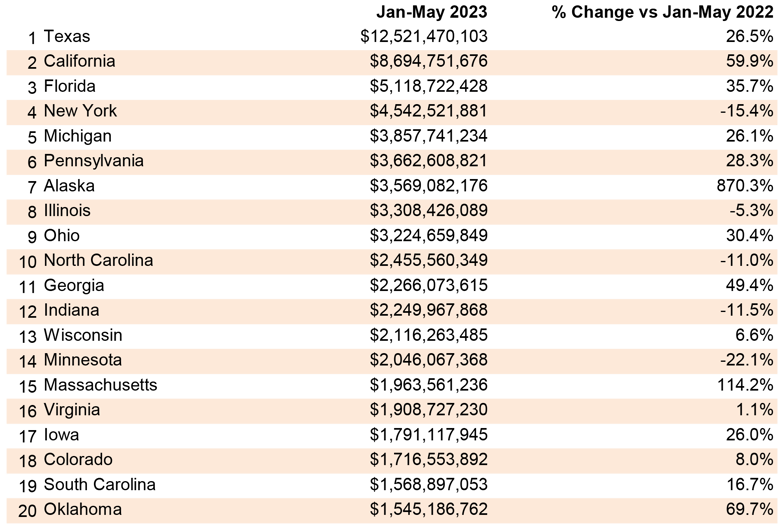
Table 5: 2023 YTD Ranking of Top 20 States by $ Volume of Heavy Engineering/Civil Construction Starts — ConstructConnect®
While not forging ahead to quite the same degree as last year, Houston and Dallas-Fort Worth in Texas continue to lead all U.S. cities in the number of residential building permits issued, by a large margin. But where do matters stand, state-wise, on the nonresidential side of construction?
Have a look at Tables 3, 4, and 5. Total nonresidential construction starts year to date in Texas are -13.3%, while in California, they are +15.0%. Nevertheless, at a dollar volume of $37.6 billion, the Lone Star State, with a first-place ranking among all states, is beating second-place California’s nonresidential starts volume of $17.8 billion by more than double (see Table 3).
The advantage Texas has over California in the subset of nonresidential that is buildings alone (i.e., dropping engineering) is even more dramatic, $25.1 billion to $9.1 billion (Table 4). The engineering starts comparison, Texas to California, is restrained, $12.5 billion to $8.7 billion (Table 5), but there’s no way to conclude that Texas is anything other than a phenomenal powerhouse.
May 2023’s y/y results for three building-related BLS Producer Price Index series were: (A) construction materials special index, -4.4% (more negative than April’s -3.0%); (B) inputs to new construction index, excluding capital investment, labor, and imports, -5.1% (a further retrenchment from the previous month’s -3.6%); and (C) final demand construction, designed to capture bid prices, +10.9% (not quite as bullish as the prior period’s +11.2%).
(A) comes from a data series with a long history, but it’s confined to a limited number of major construction materials. (B) has a shorter history, but it’s more comprehensive in its coverage, although it includes some items (e.g., transportation) that aren’t strictly materials.
There are also PPI indices for specific construction inputs. There are only a few materials currently showing y/y price increases: cement, +13.6%; ready-mix concrete, +12.9%; and gypsum products, +3.4%. There are far more items with negative y/y price performances: softwood lumber, -40.4%; diesel fuel, -38.3%; asphalt, -27.2%; aluminum mill shapes, -15.2%; hot rolled steel bars, plates, and structural shapes, -9.3%; and copper wire and cable, -7.5%. Also, there’s an inputs to highways and streets index, -2.7%.
The value of construction starts each month is derived from ConstructConnect’s database of all active construction projects in the U.S. ConstructConnect’s nonresidential construction starts series, because it is comprised of total-value estimates for individual projects, some of which are super-large, has a history of being more volatile than many other leading indicators for the economy.
From Table 6 on page 8 (and also from Table 9 on page 12) of this report, ConstructConnect’s total residential starts in May 2023 were -4.5% m/m, -35.4% y/y, and -30.7% YTD. Multifamily starts were +23.0% m/m, -43.7% y/y, and -29.1% YTD. Completing the picture, single-family starts were -13.1 m/m, -30.8% y/y, and -31.5% YTD.
Including home building with all nonresidential categories, Grand Total starts in May 2023 were +1.5% m/m, -31.8% y/y, and -11.3% YTD.
ConstructConnect adopts a research-assigned start date. In concept, a start is equivalent to ground being broken for a project to proceed. If work is abandoned or rebid, the start date is revised to reflect the new information.
Recently, the economics team at ConstructConnect has made much about rising borrowing costs and the impact it is having on the construction market. The Federal Reserve raised the Fed Funds interest rate from a historic low of 0.10% as recently as February of 2022 to a 13-year high of over 5.00% in May of this year. The Fed’s latest meeting, which concluded June 14th, marked the first time that it has not raised the Fed Funds rate in its last 11 meetings. All other interest rates, including those for mortgages, commercial loans, and government treasury debt, are directionally influenced by the Fed Funds rate.
The pause is a logical move as the full effects of such policy adjustments only occur gradually. The recent decline in the annualized rate of inflation, according to the consumer price index, from 4.9% in April to 4.0% in May brought general inflation to within 2.0% of the Fed’s long-run target. Additional rate increases by the Federal Reserve now could tip the economy into a recession, something it has thus far avoided. The pause should be welcomed by the construction industry, as rising borrowing costs have created significant concerns for financial lenders to the commercial real estate (CRE) market.
As addressed in last month’s industry snapshot and ConstructConnect’s economic news site, the cost of financing new CRE projects, along with refinancing existing debt, has become both more expensive and more challenging over the last year. Vacancy rates in office buildings have increased nearly 50% since 2020, bringing them close to 20%, according to first quarter 2023 data from Cushman & Wakefield.
Furthermore, there has been a surge in recent years of interest-only commercial mortgage loans in which regular mortgage payments only cover the interest accrued but leave the entirety of the principal due at the end. Because the principal is not paid down over time, the question is ultimately one of: Will lenders accept the greater risks of refinancing such debt as market conditions have eroded and remain uncertain? Fearing that future rents will not be able to cover the mortgage payments of refinanced debt, the concern in the CRE space is not simply one of refinancing at a higher rate, but of being able to refinance at all.
It is for this reason that the pause in the Federal Funds Rate is essential for the construction industry. As $1.5 trillion in commercial mortgages comes due over the next three years (according to Trepp Inc.), it will be critical to monitor how much of this debt can be refinanced, avoiding default. If the Federal Reserve has done its job properly, the level of defaulted CRE debt will be manageable and stop short of causing a recession. In the meantime, construction firms will do well to conserve capital by adjusting inventory levels to meet demand and tightening their accounts receivable. - Michael Guckes, Senior Economist
A rule of thumb is that nonresidential construction is a lagging indicator among economic measures. Companies are hesitant to undertake capital spending until their personnel needs are rapidly expanding and their office square footage or plant footprints are straining capacity. Plus, it helps if profits are abundant.
The rule doesn’t always hold true, however. For example, under present circumstances, weakness in some (mainly cyclical) areas of construction investment may well be offset by rich veins of large industrial and engineering projects.
Each month, ConstructConnect publishes information on upcoming construction projects at its Expansion Index.
The Expansion Index, for hundreds of cities in the United States and Canada, calculates the ratio, based on dollar volume, of projects in the planning stage, at present, divided by the comparable figure a year ago. The ratio moves above 1.0 when there is currently a larger dollar volume of construction prospects than there was last year at the same time. The ratio sinks below 1.0 when the opposite is the case. The results are set out in interactive maps for both countries.
Click here to download the Construction Industry Snapshot Package - June 2023 PDF.
Click here for the Top 10 Project Starts in the U.S. - May 2023.
Click here for the Nonresidential Construction Starts Trend Graphs - May 2023.
ConstructConnect's March 2023 volume of nonresidential construction starts was $47.6 billion, an increase of +45.0% versus February 2023.
ConstructConnect's March 2023 volume of nonresidential construction starts was $47.6 billion, an increase of +45.0% versus February 2023.
ConstructConnect announced June 2023’s volume of nonresidential construction starts was $63.2 billion, up +25.5% versus May 2023’s $50.3 billion.
ConstructConnect announced today that January 2023’s volume of nonresidential construction starts was $57.0 billion versus December’s $50.0 billion.